
Workplace Fire Deaths in the U.S.: Fire and Explosion Fatalities at Work, 2011 to 2024
- Primary data
- BLS Census of Fatal Occupational Injuries (CFOI), event division 3 'Fires and explosions' (2011-2022) and 'Explosions and fires' (2023-2024)
- Data period
- 2011 to 2024
- Latest release used
- 2026-02-19
- Next release
- 2026-12-16 (CFOI 2025 data)
- Geography
- United States
- Sources
- 22 (22 Tier 1)
Workplace fire deaths in the United States totaled 93 in 2024: 56 from explosions and 37 from fires, out of 5,070 fatal work injuries. That is 1.83% of all work deaths and 30.9% below the 2011 to 2015 average of 134.6 a year, while total work deaths rose 7.6%.
This month in brief
- Fires and explosions killed 1,549 U.S. workers from 2011 through 2024, according to BLS CFOI counts compiled for this report.
- The annual count fell from an average of 134.6 in 2011 to 2015 to 90.2 in 2020 to 2024, a 33.0% drop, while total workplace deaths rose.
- Measured per hour worked, the fire and explosion death rate fell 38.0%, from 0.100 to 0.062 per 100,000 full-time equivalent (FTE) workers between the same two periods.
- Explosions, not fires, cause most of these deaths: 59.4% in 2011 to 2022 and 61.9% in 2023 to 2024. Pressure vessel, piping and tire explosions are the largest single subtype.
- Mining, quarrying and oil and gas extraction has the highest rate by far, 1.246 per 100,000 FTE in 2011 to 2022. Manufacturing has the most deaths of any private sector, 197.
- Four occupation groups (production, construction and extraction, installation and repair, transportation and material moving) account for 62.8% of 2011 to 2022 deaths.
- Nonfatal fire and explosion injuries have not fallen: private employers reported 1,470 days-away cases a year in 2023 to 2024 against 1,516 a year in 2011 to 2015.
- BLS changed its event coding in 2023, so 2023 and 2024 are a break in series; this report flags every comparison that crosses it.
Workplace fire deaths by year, 2011 to 2024
The count of workers killed by fires and explosions has fallen by about a third since the early 2010s, even as total workplace deaths rose. The decline is real but uneven: single bad years such as 2013 and 2022 still stand out.
Workplace fire deaths: In this report, deaths that BLS codes to OIICS event division 3, 'Fires and explosions' (2011 to 2022) or 'Explosions and fires' (2023 onward). The division covers fires, explosions and flash fires at work. It excludes deaths from electrocution, burns from contact with hot objects, and transportation incidents coded to a vehicle event.
| Year | All workplace deaths | Fire and explosion deaths | Explosions | Fires | Share of all deaths (%) | Rate per 100,000 FTE | Event coding |
|---|---|---|---|---|---|---|---|
| 2011 | 4,693 | 144 | 82 | 62 | 3.07 | 0.112 | OIICS 2.01 |
| 2012 | 4,628 | 122 | 88 | 34 | 2.64 | 0.092 | OIICS 2.01 |
| 2013 | 4,585 | 149 | 67 | 82 | 3.25 | 0.111 | OIICS 2.01 |
| 2014 | 4,821 | 137 | 84 | 53 | 2.84 | 0.1 | OIICS 2.01 |
| 2015 | 4,836 | 121 | 75 | 46 | 2.5 | 0.087 | OIICS 2.01 |
| 2016 | 5,190 | 88 | 55 | 32 | 1.7 | 0.062 | OIICS 2.01 |
| 2017 | 5,147 | 123 | 85 | 38 | 2.39 | 0.086 | OIICS 2.01 |
| 2018 | 5,250 | 115 | 71 | 44 | 2.19 | 0.079 | OIICS 2.01 |
| 2019 | 5,333 | 99 | 57 | 42 | 1.86 | 0.067 | OIICS 2.01 |
| 2020 | 4,764 | 71 | 40 | 31 | 1.49 | 0.053 | OIICS 2.01 |
| 2021 | 5,190 | 76 | 45 | 31 | 1.46 | 0.054 | OIICS 2.01 |
| 2022 | 5,486 | 107 | 54 | 53 | 1.95 | 0.073 | OIICS 2.01 |
| 2023 | 5,283 | 104 | 66 | 38 | 1.97 | 0.07 | OIICS 3.0x |
| 2024 | 5,070 | 93 | 56 | 37 | 1.83 | 0.062 | OIICS 3.0x |
Rate is our calculation: deaths / hours worked x 200,000,000. Fires and explosions may not sum to the total where BLS could not classify the subtype. 2023 onward coded under OIICS 3.0.
Source: [1][3][7][6][8][11][12][13] U.S. Bureau of Labor Statistics; U.S. Bureau of Labor Statistics; U.S. Bureau of Labor Statistics; U.S. Bureau of Labor Statistics; U.S. Bureau of Labor Statistics; U.S. Bureau of Labor Statistics; U.S. Bureau of Labor Statistics; U.S. Bureau of Labor Statistics
Deaths per year, all U.S. workers
Source: BLS Census of Fatal Occupational Injuries, flat files 2011-2022 and Table A-1 2023-2024 (released February 19, 2026)
BLS counted 144 fire and explosion deaths in 2011 and 93 in 2024. The five-year average fell from 134.6 a year in 2011 to 2015 to 90.2 a year in 2020 to 2024, a 33.0% decline (BLS CFOI flat files; CFOI Table A-1, 2024).
Total work deaths moved the other way. The all-event count averaged 4,712.6 a year in 2011 to 2015 and reached 5,070 in 2024, 7.6% higher. As a result, fires and explosions fell from 2.86% of all U.S. work deaths in 2011 to 2015 to 1.75% in 2020 to 2024.
The highest year in the series was 2013, with 149 deaths. In BLS occupation data that year, protective service occupations recorded 43 fire and explosion deaths, against 11 to 19 in 2011, 2014 and 2015. The low was 2020, with 71 deaths, when hours worked also dropped to 269,900 million from 296,600 million in 2019.
Deaths per 100,000 full-time workers
Counts can fall simply because fewer people work in risky jobs. Dividing by hours worked shows the decline holds per unit of exposure: the rate fell faster than the count.
We divided each year's fire and explosion deaths by total hours worked from the BLS hours-based rate files and applied the BLS base of 200,000,000 hours, which represents 100,000 full-time workers at 40 hours a week for 50 weeks (BLS hours-based rates, 2024).
The resulting rate was 0.112 deaths per 100,000 FTE in 2011 and 0.062 in 2024. Pooled over five-year windows it fell from 0.100 in 2011 to 2015 to 0.062 in 2020 to 2024, a 38.0% decline. For comparison, BLS published an all-cause rate of 3.3 per 100,000 FTE in 2024 (CFOI 2024 release).
Deaths divided by hours worked, times 200,000,000
Source: FLS calculation from BLS CFOI counts and BLS hours-based rate files, 2011-2024
These rates are our calculation, not BLS publications. BLS does not publish an hours-based rate for the fire and explosion event group. Our numerator includes a small number of deaths that BLS removes before computing its own rates (workers under 16, volunteers and resident military), so the figures run slightly high, by about the gap between our implied 2024 all-cause rate of 3.41 and the published 3.3.
Explosions outnumber fires
Most workers in this event group die in explosions rather than fires. Pressure vessel, piping and tire explosions are the single largest cause, and they have also fallen the most.
2023 onward coded under OIICS 3.0
Source: BLS CFOI flat files 2011-2022; CFOI Table A-9, 2023 and 2024
From 2011 to 2022, BLS coded 803 deaths to explosions and 548 to fires, so explosions made up 59.4% of the event group. In 2023 to 2024 the explosion share was 61.9% (CFOI Table A-9, 2024; Table A-9, 2023).
Part of that small increase may come from coding rather than events. OIICS 3.0 moved explosions ahead of fires in order of precedence; before 2023, BLS notes, an explosion that began as a fire was coded as a fire only (OIICS version 3 major changes).
| Event subtype | Avg per year 2011-2015 | Avg per year 2018-2022 | 2023 | 2024 | Total 2011-2022 |
|---|---|---|---|---|---|
| Structural fire, with or without collapse | 19.2 | 13.0 | 13 | 16 | 193 |
| Vehicle or machinery fire | 5.2 | 3.2 | not published | 8 | 45 |
| Forest, brush or wildfire | 8.2 | 1.2 | 5 | not published | 57 |
| Dust explosion | 1.4 | 1.0 | 2 | not published | 21 |
| Explosion of nonpressurized vapors, gases, or liquids | 25.2 | 17.6 | 24 | 21 | 264 |
| Explosion of pressure vessel, piping, or tire | 35.6 | 19.4 | 33 | 30 | 338 |
Subtypes mapped across OIICS 2.01 and 3.0 by title. 'Not published' means BLS suppressed or did not list the cell.
Source: [1][6][8] U.S. Bureau of Labor Statistics; U.S. Bureau of Labor Statistics; U.S. Bureau of Labor Statistics
Explosions of pressure vessels, piping or tires killed an average of 35.6 workers a year in 2011 to 2015 and 19.4 a year in 2018 to 2022, a 45.5% drop under the same coding rules. Structural fires fell 32.3% over the same comparison, from 19.2 to 13.0 a year. Wildfire and brush fire deaths averaged 8.2 a year in 2011 to 2015, a figure lifted by 2013, and 1.2 a year in 2018 to 2022.
Facilities that store or process flammable liquids, gases or combustible dusts often use fixed special hazard suppression systems; the inspection intervals for those systems are summarized on our special hazard suppression inspection page.
Which industries record the most fire and explosion deaths
Manufacturing records the most deaths, but mining, quarrying and oil and gas extraction carries by far the highest risk per hour worked. Local government ranks second by count.
We summed the BLS sector series for 2011 to 2022, the 12 years coded under one classification, and divided by each sector's hours worked from the BLS hours-based rate files (CFOI archive).
| Industry sector | Deaths 2011-2022 | Years published (of 12) | Share of sector's work deaths (%) | Rate per 100,000 FTE, 2011-2022 | 2023 | 2024 |
|---|---|---|---|---|---|---|
| Manufacturing | 197 | 11 | 5.2 | 0.118 | not published | 11 |
| Local government (all industries) | 170 | 12 | 5.2 | 0.153 | 15 | not published |
| Mining, quarrying, and oil and gas extraction | 141 | 11 | 9.2 | 1.246 | not published | 7 |
| Construction | 135 | 11 | 1.2 | 0.117 | 17 | 5 |
| Agriculture, forestry, fishing and hunting | 122 | 12 | 1.9 | 0.439 | 9 | 9 |
| Other services, except public administration | 113 | 12 | 4.7 | 0.149 | 9 | 12 |
| Transportation and warehousing | 85 | 11 | 0.8 | 0.12 | 6 | not published |
| Wholesale trade | 63 | 10 | 2.9 | 0.145 | not published | 7 |
| Retail trade | 53 | 10 | 1.6 | 0.031 | 5 | 3 |
| Administrative and support and waste services | 43 | 8 | 0.8 | n/a | 3 | not published |
| Utilities | 10 | 5 | 3.1 | 0.082 | not published | not published |
Private industry sectors plus local government (all industries). Rates exclude years without a sector hours row; administrative and waste hours are not reported separately.
Source: [1][11][3][7] U.S. Bureau of Labor Statistics; U.S. Bureau of Labor Statistics; U.S. Bureau of Labor Statistics; U.S. Bureau of Labor Statistics
Deaths per 100,000 FTE, pooled 12 years
Source: FLS calculation from BLS CFOI sector series and hours-based rate files, 2011-2022
Mining, quarrying and oil and gas extraction recorded 1.246 fire and explosion deaths per 100,000 FTE in 2011 to 2022, 15.4 times the all-industry rate of 0.081. Fires and explosions caused 9.2% of all deaths in that sector. Agriculture, forestry, fishing and hunting had the next highest rate, 0.439.
Manufacturing recorded 197 deaths, the largest private sector count, and fires and explosions caused 5.2% of all manufacturing work deaths. Retail trade had the lowest rate among the sectors measured, 0.031 per 100,000 FTE.
Transportation and warehousing recorded 85 fire and explosion deaths in 2011 to 2022, 0.8% of the sector's work deaths, where vehicle crashes dominate. Building-type guidance for storage facilities is on our warehouses page.
| NAICS | Industry | Published deaths 2015-2022 (minimum) | Years published (of 8) |
|---|---|---|---|
| 238 | Specialty trade contractors | 50 | 6 |
| 2382 | Building equipment contractors | 15 | 3 |
| 213 | Support activities for mining | 51 | 6 |
| 213112 | Support activities for oil and gas operations | 31 | 4 |
| 111 | Crop production | 43 | 7 |
| 811 | Repair and maintenance | 37 | 5 |
| 8111 | Automotive repair and maintenance | 29 | 5 |
| 484 | Truck transportation | 21 | 4 |
| 112 | Animal production and aquaculture | 19 | 5 |
| 237 | Heavy and civil engineering construction | 15 | 4 |
| 325 | Chemical manufacturing | 15 | 3 |
| 332 | Fabricated metal product manufacturing | 13 | 4 |
| 423 | Merchant wholesalers, durable goods | 13 | 3 |
| 441 | Motor vehicle and parts dealers | 11 | 3 |
| 562 | Waste management and remediation services | 9 | 2 |
Sum of published Table A-1 cells, private industry. Parent and child NAICS rows overlap. Suppressed cells are excluded, so each figure is a minimum.
Source: [11] U.S. Bureau of Labor Statistics
Below the sector level BLS suppresses many cells, so the detailed counts in the second table are published minimums for 2015 to 2022. Specialty trade contractors (NAICS 238) had at least 50 deaths, support activities for mining (NAICS 213) at least 51, and crop production (NAICS 111) at least 43 (CFOI Table A-1, 2015 to 2022).
Which occupations face the highest risk
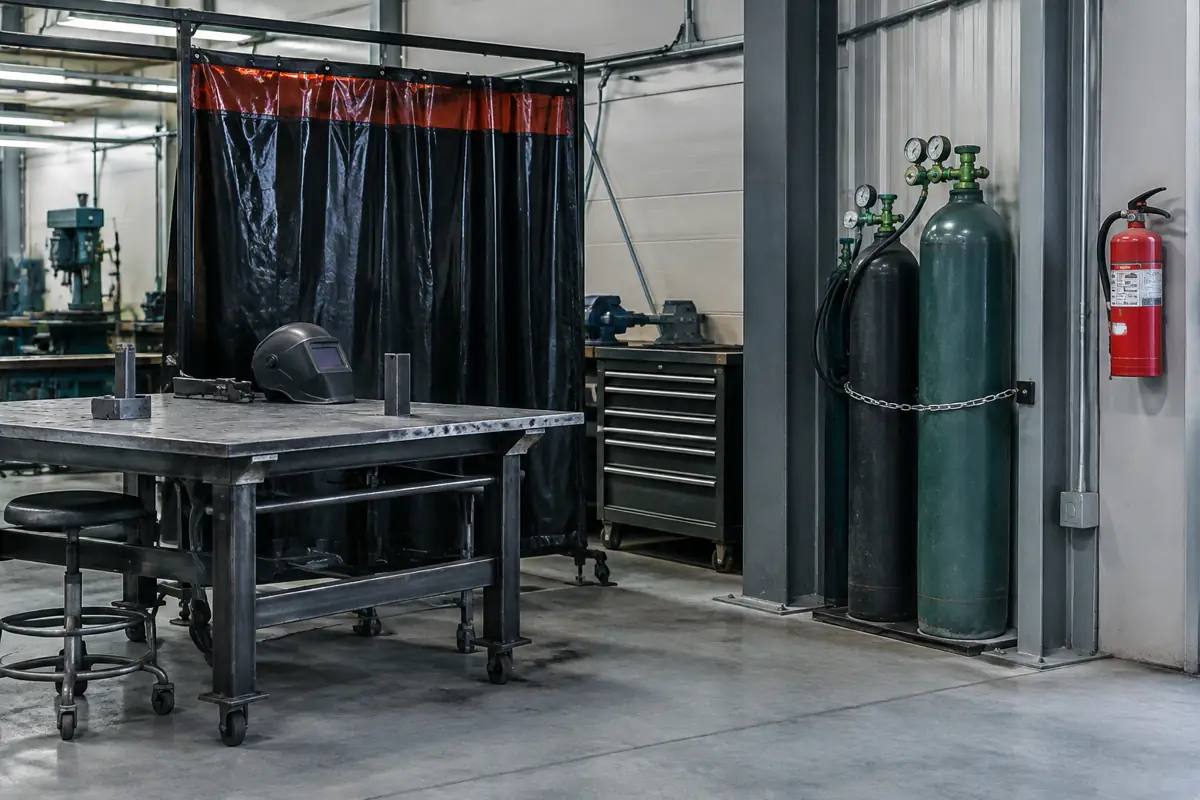
Hands-on trades dominate. Production workers, construction and extraction workers, mechanics and repairers, and drivers and material movers make up most of the deaths; mechanics and protective service workers have the highest rates.
| Occupation group | Deaths 2011-2022 | Years published (of 12) | Share of group's work deaths (%) | Rate per 100,000 FTE, 2011-2022 | 2023 | 2024 |
|---|---|---|---|---|---|---|
| Production | 250 | 12 | 9.1 | 0.253 | not published | not published |
| Construction and extraction | 245 | 12 | 2.2 | 0.272 | 18 | 13 |
| Installation, maintenance, and repair | 211 | 11 | 4.3 | 0.357 | not published | not published |
| Transportation and material moving | 143 | 11 | 0.9 | 0.13 | 9 | 15 |
| Protective service | 129 | 9 | 4.2 | 0.344 | 17 | not published |
| Management | 96 | 11 | 2.0 | 0.044 | 9 | 3 |
| Farming, fishing, and forestry | 35 | 6 | 1.1 | 0.28 | 3 | 5 |
| Building and grounds cleaning and maintenance | 25 | 8 | 0.7 | 0.044 | not published | not published |
| Sales and related | 22 | 6 | 0.8 | 0.013 | not published | not published |
Years BLS did not publish count as zero in the pooled totals.
Source: [1][11][4][9] U.S. Bureau of Labor Statistics; U.S. Bureau of Labor Statistics; U.S. Bureau of Labor Statistics; U.S. Bureau of Labor Statistics
Total deaths, 12 years
Source: BLS CFOI occupation series, flat files 2011-2022
Production occupations recorded 250 fire and explosion deaths in 2011 to 2022 and construction and extraction occupations 245. Installation, maintenance and repair occupations recorded 211 deaths and the highest rate of any group, 0.357 per 100,000 FTE (BLS CFOI flat files).
Fires and explosions caused 9.1% of all deaths among production workers, compared with 2.2% among construction and extraction workers, where falls and contact incidents dominate. Protective service occupations, which include firefighters, recorded 129 deaths at 0.344 per 100,000 FTE.
| SOC | Occupation | Published deaths 2015-2022 (minimum) | Years published (of 8) |
|---|---|---|---|
| 47-2000 | Construction trades workers | 57 | 5 |
| 49-3000 | Vehicle and mobile equipment mechanics, installers, and repairers | 69 | 7 |
| 51-4121 | Welders, cutters, solderers, and brazers | 49 | 6 |
| 47-5000 | Extraction workers | 30 | 5 |
| 11-9013 | Farmers, ranchers, and other agricultural managers | 33 | 5 |
| 53-3030 | Driver/sales workers and truck drivers | 26 | 4 |
| 49-3020 | Automotive technicians and repairers | 28 | 5 |
| 33-2011 | Firefighters | 26 | 4 |
| 47-1011 | First-line supervisors of construction trades and extraction workers | 21 | 6 |
| 47-2150 | Pipelayers, plumbers, pipefitters, and steamfitters | 15 | 3 |
| 47-2061 | Construction laborers | 10 | 3 |
| 53-7060 | Laborers and material movers, hand | 18 | 4 |
Sum of published Table A-5 cells. Parent and child SOC rows overlap. Each figure is a minimum.
Source: [11] U.S. Bureau of Labor Statistics
Among detailed occupations, vehicle and mobile equipment mechanics had at least 69 published deaths in 2015 to 2022 and welders, cutters, solderers and brazers at least 49. Firefighters had at least 26 published deaths in 2015 to 2018; the detailed firefighter cell was not published for 2019 to 2022.
2024 worker profile: 94.6% of fire and explosion deaths were men, against 91.9% of all work deaths; 18.3% were self-employed, against 17.5%; and 33.3% were 55 or older, against 36.6% (CFOI Table A-7, 2024).
Nonfatal injuries behind each death
Deaths fell, but serious nonfatal injuries from fires and explosions did not. These injuries are rare but long: the median fire injury kept a worker away nearly three times as long as the median work injury.
| Period | DAFW cases, fires and explosions | Fires | Explosions | DAFW cases, all events | Event coding |
|---|---|---|---|---|---|
| 2011 | 1,680 | 650 | 1030 | 918,140 | OIICS 2.01 |
| 2012 | 1,840 | 1,020 | 820 | 918,720 | OIICS 2.01 |
| 2013 | 1,470 | 830 | 510 | 917,090 | OIICS 2.01 |
| 2014 | 1,320 | 590 | 720 | 916,440 | OIICS 2.01 |
| 2015 | 1,270 | 600 | 670 | 902,160 | OIICS 2.01 |
| 2016 | 1,420 | 720 | 680 | 892,270 | OIICS 2.01 |
| 2017 | 1,470 | 440 | 1020 | 882,730 | OIICS 2.01 |
| 2018 | 1,480 | 650 | 830 | 900,380 | OIICS 2.01 |
| 2019 | 1,700 | 760 | 940 | 888,220 | OIICS 2.01 |
| 2020 | 1,770 | 1,200 | 570 | 1,176,340 | OIICS 2.01 |
| 2023-2024 (two-year total) | 2,940 | 2,000 | 930 | 1,834,600 | OIICS 3.0x |
2011 to 2020 annual estimates; 2023-2024 is a two-year total from the biennial release. BLS published no single-year event estimates for 2021 to 2024.
Source: [16][17][19] U.S. Bureau of Labor Statistics; U.S. Bureau of Labor Statistics; U.S. Bureau of Labor Statistics
Private employers reported 2,940 days-away-from-work (DAFW) cases from explosions and fires over the two-year 2023 to 2024 period, or 1,470 a year (SOII Table R64). That is 3.0% below the 2011 to 2015 private industry average of 1,516 a year, essentially flat while deaths fell by about a third.
Flash fires caused 1,490 of those 2,940 cases, or 50.7%. Fires (without explosions) had a median of 23 days away from work and the full explosions and fires group a median of 17, against 8 days for all events (SOII Table R70). 1,150 cases, 39.1%, lasted 31 days or more.
Private industry, days-away-from-work cases
Source: BLS SOII Table R70, 2023-2024 (released January 22, 2026)
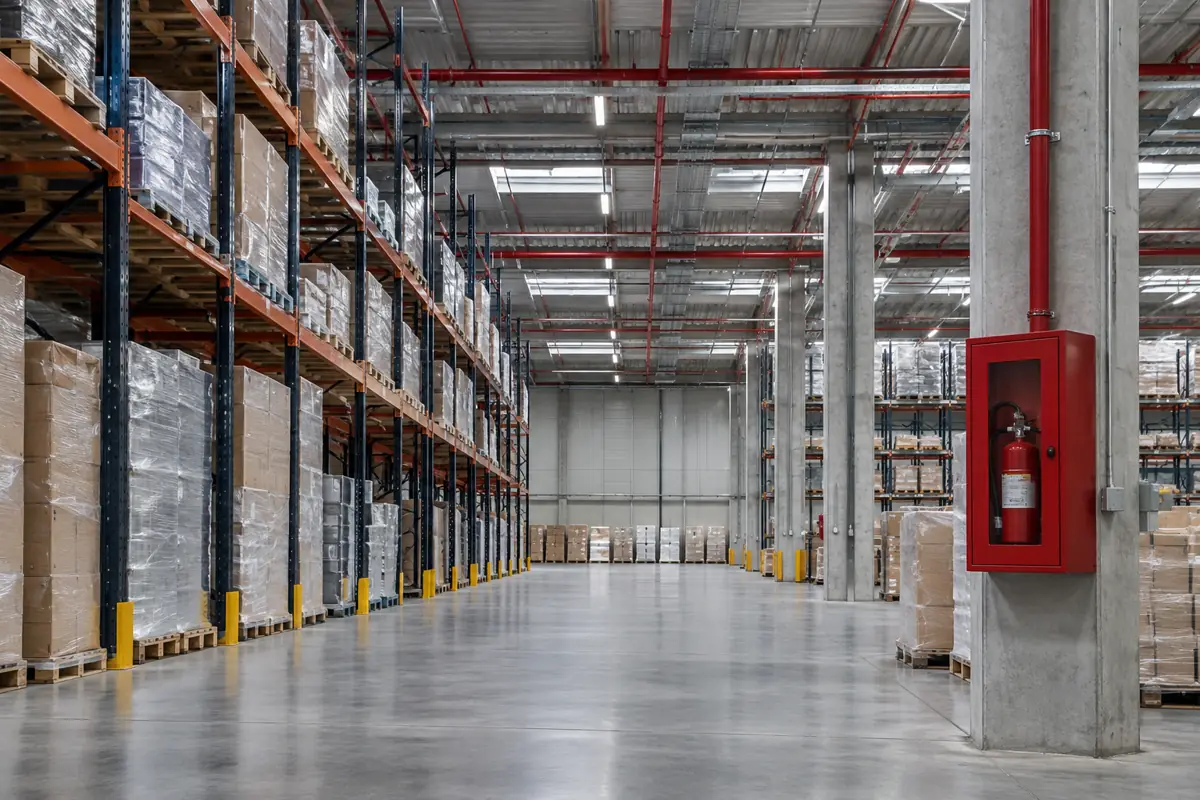
Set against private industry deaths, the ratio shows how lethal this event group is. There were 18.1 DAFW cases per fire or explosion death in private industry in 2023 to 2024, against 194.1 per death for all events: a serious fire or explosion injury is 10.7 times as likely to be fatal as the average serious work injury. Portable extinguisher inspection rules, which matter most for small incipient fires, are summarized on our fire extinguisher inspection page.
Momentum and share analysis
Change in annual deaths versus the 2011 to 2015 baseline
Formula(deaths in 2024 / mean deaths 2011 to 2015 - 1) x 100
Inputs: fact_sheet rows for fire and explosion deaths 2011 to 2015 and 2024 (derived_metrics d2, d3) (fact sheet rows)
Result: -30.9% (93 vs 134.6)
The 2024 count is about a third below the early 2010s, while all-event deaths were 7.6% higher.
Limitations: Crosses the 2023 OIICS 3.0 break; single-year counts are volatile.
Fire and explosion death rate per 100,000 FTE
Formuladeaths / (hours worked in millions x 1,000,000) x 200,000,000
Inputs: fact_sheet rows for deaths and hours worked by year (derived_metrics d5, d6) (fact sheet rows)
Result: 0.100 in 2011 to 2015, 0.062 in 2020 to 2024, -38.0%
Risk per hour worked fell faster than the count because hours worked grew.
Limitations: Our calculation; numerator includes groups BLS excludes from its rates, so values run slightly high.
Industry sector rates, 2011 to 2022 pooled
Formulasum of sector deaths / sum of sector hours x 200,000,000
Inputs: fact_sheet sector rows (derived_metrics d11 to d13, d15) (fact sheet rows)
Result: Mining 1.246, agriculture 0.439, local government 0.153, all industries 0.081
Mining is 15.4 times the all-industry rate; manufacturing has the most deaths but a rate close to the all-industry average.
Limitations: Years BLS did not publish count as zero; manufacturing excludes 2019, which has no hours row.
Occupation group rates, 2011 to 2022 pooled
Formulasum of group deaths / sum of group hours x 200,000,000
Inputs: fact_sheet occupation group rows (derived_metrics d14, d17) (fact sheet rows)
Result: Installation, maintenance and repair 0.357; protective service 0.344; farming, fishing and forestry 0.28; construction and extraction 0.272
The top four groups by count hold 62.8% of deaths.
Limitations: Unpublished years count as zero.
Lethality ratio: serious nonfatal cases per death
Formulaprivate DAFW cases 2023 to 2024 / private deaths 2023 plus 2024
Inputs: fact_sheet SOII and private industry rows (derived_metrics d20) (fact sheet rows)
Result: 18.1 for explosions and fires vs 194.1 for all events (10.7x)
Fires and explosions produce far fewer serious injuries per death than other events, a marker of how often they kill outright.
Limitations: SOII and CFOI scopes differ: SOII excludes the self-employed and is a sample survey.
Nonfatal trend versus fatal trend
Formula2023 to 2024 private DAFW cases / 2 vs mean 2011 to 2015
Inputs: fact_sheet SOII rows (derived_metrics d19) (fact sheet rows)
Result: 1,470 vs 1,516 a year, -3.0%
Serious nonfatal injuries held steady while deaths fell by about a third.
Limitations: OIICS break and biennial reporting; sampling error not shown.
Findings to track
- 93 U.S. workers died from fires and explosions in 2024, 1.83% of the 5,070 fatal work injuries recorded that year.[3][2]
- The 2024 count is 30.9% below the 2011 to 2015 average of 134.6 deaths a year; all-event work deaths were 7.6% above their 2011 to 2015 average in 2024.[1][3]
- The 2011 to 2024 peak was 149 deaths in 2013; the low was 71 in 2020.[1]
- Fires and explosions were 2.86% of all U.S. work deaths in 2011 to 2015 and 1.75% in 2020 to 2024.[1][3][7]
- In 2024 there was one fire or explosion death at work roughly every 3.9 days.[3]
- Explosion of a pressure vessel, piping or tire killed 338 workers in 2011 to 2022 and 30 in 2024, the largest single event subtype.[1][6]
- Explosions of nonpressurized vapors, gases or liquids killed 264 workers in 2011 to 2022 and 21 in 2024.[1][6]
- Mining, quarrying and oil and gas extraction recorded 141 fire and explosion deaths in 2011 to 2022, 9.2% of all deaths in that sector, at 1.246 per 100,000 FTE.[1][11]
- Manufacturing recorded 197 fire and explosion deaths in 2011 to 2022, the most of any private sector, at 0.118 per 100,000 FTE.[1][11]
- Local government accounted for 170 fire and explosion deaths in 2011 to 2022, 12.6% of the national total.[1]
- Installation, maintenance and repair occupations had the highest occupation group rate in 2011 to 2022, 0.357 per 100,000 FTE, followed by protective service at 0.344.[1][11]
- Men were 94.6% of 2024 fire and explosion deaths (88 of 93), compared with 91.9% of all 2024 work deaths.[5]
- Fires (without explosions) kept injured private industry workers away from work a median 23 days in 2023 to 2024, against 8 days for all injury events.[18]
- Flash fires caused 1,490 of the 2,940 private industry days-away cases from explosions and fires in 2023 to 2024, or 50.7%.[17]
Questions people ask
How many people die from workplace fires each year?
BLS counted 93 workplace deaths from fires and explosions in 2024 and 104 in 2023. The 2020 to 2024 average was 90.2 a year.
Are workplace fire deaths going up or down?
Down. The 2024 count of 93 is 30.9% below the 2011 to 2015 average of 134.6, and the rate per 100,000 FTE fell 38.0% between 2011 to 2015 and 2020 to 2024.
Which industries and jobs have the most workplace fire deaths?
Manufacturing had the most among private sectors in 2011 to 2022 (197); mining, quarrying and oil and gas extraction had the highest rate (1.246 per 100,000 FTE). Production and construction and extraction occupations had the most deaths by job group.
What percentage of workplace deaths are from fires and explosions?
1.83% in 2024 (93 of 5,070), down from 2.86% in 2011 to 2015.
Download the data
Every table in this report is available as a CSV under CC BY 4.0. The fact sheet lists each value with its source URL and access date.
- derived_metrics.csv (CSV)
- fact_sheet.csv (CSV)
- Workplace fire and explosion deaths by year, United States, 2011 to 2024 (CSV)
- Fire and explosion deaths by event subtype, 2011 to 2024 (CSV)
- Fire and explosion deaths by industry sector, 2011 to 2022 pooled, with 2023 and 2024 (CSV)
- Fire and explosion deaths by occupation group, 2011 to 2022 pooled, with 2023 and 2024 (CSV)
- Detailed industries with the most published fire and explosion deaths, 2015 to 2022 (CSV)
- Detailed occupations with the most published fire and explosion deaths, 2015 to 2022 (CSV)
- Nonfatal days-away-from-work cases from fires and explosions, private industry (CSV)
For journalists and researchers
If you cite only a few, cite these
- 93 U.S. workplace deaths from fires and explosions in 2024, 1.83% of all work deaths.[3][2]
- Fire and explosion death rate fell 38.0%, from 0.100 to 0.062 per 100,000 FTE, between 2011 to 2015 and 2020 to 2024.[1][11][12]
- Mining's fire and explosion death rate was 1.246 per 100,000 FTE in 2011 to 2022.[1][11]
Most quotable statistics
- Fires and explosions killed 93 U.S. workers in 2024, 30.9% fewer than the 2011 to 2015 average of 134.6 a year.[1][3]
- Explosions caused 59.4% of U.S. workplace fire and explosion deaths in 2011 to 2022.[1]
- Mining, quarrying and oil and gas extraction recorded 1.246 fire and explosion deaths per 100,000 full-time workers in 2011 to 2022, 15.4 times the all-industry rate.[1][11]
- Serious nonfatal fire and explosion injuries held steady at about 1,470 cases a year in 2023 to 2024 while deaths fell.[17][16]
- A serious fire or explosion injury at work is 10.7 times as likely to be fatal as the average serious work injury (private industry, 2023 to 2024).[17][7][3]
- Fires without explosions kept injured workers off the job a median 23 days in 2023 to 2024, against 8 days for all injuries.[18]
Press summary
Fires and explosions killed 93 workers in the United States in 2024, according to a Fire Life and Safety analysis of Bureau of Labor Statistics fatality records. That is 30.9% below the 2011 to 2015 average of 134.6 deaths a year, even though total workplace deaths rose 7.6% over the same comparison. Per hour worked, the fire and explosion death rate fell 38.0%, to 0.062 per 100,000 full-time workers in 2020 to 2024. Explosions, led by pressure vessel, piping and tire explosions, cause about three in five of these deaths. Mining, quarrying and oil and gas extraction has the highest rate, 1.246 per 100,000 full-time workers in 2011 to 2022, 15.4 times the all-industry rate. Serious nonfatal injuries have not followed deaths down: private employers reported about 1,470 days-away cases a year in 2023 to 2024, close to the 1,516 a year of 2011 to 2015. BLS will release 2025 data on December 16, 2026.
Suggested headlines
- Workplace fire and explosion deaths fall 30.9% from early-2010s levels
- Explosions, not fires, cause three in five workplace fire deaths
- Mining's fire and explosion death rate is 15.4 times the U.S. average
- Fire injuries at work hold steady at about 1,470 serious cases a year
- A serious fire or explosion injury is 10.7 times as likely to kill as other work injuries
How to cite this report
Fire Life and Safety. (2026). Workplace Fire Deaths in the U.S.: Fire and Explosion Fatalities at Work, 2011 to 2024. Retrieved from https://firelifeandsafety.com/reports/workplace-fire-and-explosion-deaths/
Reuse license
Data and tables are licensed CC BY 4.0. Attribution: “Source: Fire Life and Safety, Workplace Fire Deaths in the U.S.: Fire and Explosion Fatalities at Work, 2011 to 2024” with a link to this page.
Frequently asked questions
How many U.S. workers died in fires and explosions in 2024?
93, according to the BLS Census of Fatal Occupational Injuries released February 19, 2026: 56 in explosions and 37 in fires.
How many workers died from fires and explosions in 2023?
104: 66 in explosions and 38 in fires (BLS CFOI, 2023).
What share of all work deaths do fires and explosions cause?
1.83% in 2024. Across 2020 to 2024 the share was 1.75%, down from 2.86% in 2011 to 2015.
What is the fire and explosion death rate at work?
About 0.062 deaths per 100,000 full-time equivalent workers in 2024, by our calculation from BLS counts and hours worked.
Which year had the most workplace fire and explosion deaths since 2011?
2013, with 149 deaths. The lowest year was 2020, with 71.
Which industry is most dangerous for fires and explosions?
Mining, quarrying and oil and gas extraction, at 1.246 deaths per 100,000 FTE in 2011 to 2022, 15.4 times the all-industry rate of 0.081.
Which occupations are most at risk?
By count, production (250 deaths) and construction and extraction (245) in 2011 to 2022. By rate, installation, maintenance and repair (0.357 per 100,000 FTE) and protective service (0.344).
Do explosions or fires kill more workers?
Explosions: 803 deaths against 548 for fires in 2011 to 2022, and 122 against 75 in 2023 to 2024.
How many workers are seriously injured by workplace fires and explosions?
Private employers reported 2,940 days-away-from-work cases from explosions and fires in 2023 to 2024, about 1,470 a year.
When will 2025 workplace fire death data be released?
BLS has scheduled CFOI 2025 data for December 16, 2026.
Methodology
Scope: deaths that BLS codes to OIICS event division 3 (fires and explosions) in the Census of Fatal Occupational Injuries, all U.S. workers including the self-employed and government, 2011 to 2024. CFOI is a census, not a sample: BLS confirms each case with at least two independent source documents. The 2024 data were released February 19, 2026; the 2025 data are scheduled for December 16, 2026.
Data assembly: we streamed the full BLS fw database (4,792,838 series rows and 11,303,022 data rows) and kept every national series in event division 3 plus all-event totals, giving annual counts for 2011 to 2022 by subtype, industry sector, occupation group and worker characteristic. For 2023 and 2024, which are not in the flat files, we parsed BLS Tables A-1, A-5, A-7 and A-9. For detailed industries and occupations we parsed all 16 Tables A-1 and A-5 for 2015 to 2022 and summed the published cells.
Rates: BLS does not publish an hours-based rate for this event group. We divided deaths by total hours worked from the BLS hours-based rate files (civilian workers, from the Current Population Survey) and multiplied by 200,000,000, the BLS base for 100,000 full-time workers. Sector and occupation rates pool 2011 to 2022 deaths and hours. Our numerator includes some workers BLS excludes from its own rates, so our rates run slightly high.
Suppression: BLS does not publish cells that fail its publication criteria. Unpublished years count as zero in pooled totals, so pooled sector, occupation and detailed counts are minimums. The 'years published' column shows how complete each total is.
Classification breaks: BLS implemented OIICS 3.0 for reference year 2023 and calls 2023 a break in series. OIICS 3.0 reversed the precedence of explosions and fires and added a wildfire code. We keep pooled analysis to 2011 to 2022 where comparability matters and flag every comparison that crosses 2023. Occupation codes changed from SOC 2010 to SOC 2018 in 2019 data and industry codes follow successive NAICS versions; major groups and sectors are stable.
Nonfatal injuries: SOII case data cover private industry days-away-from-work cases. Annual estimates for 2011 to 2020 come from the BLS cs database through the keyless BLS Public API v1. For 2021 onward BLS publishes case data every two years; the 2023-2024 figures are two-year totals, which we halve to annualize. SOII is a sample survey and excludes the self-employed, small farms and federal workers.
Excluded: OSHA fatality inspection records were not used because we found no keyless bulk download; Chemical Safety Board investigations, fire deaths by state and OSHA fire safety citations are covered in separate reports. No employer involved in a fatal incident is named. This report describes statistics and is not safety, legal or engineering advice.
Last updated 2026-10-27. Every figure traces to fact_sheet.csv, derived_metrics.csv or a table CSV, and the scripts in the scripts folder rebuild the dataset from the BLS files.
This report presents published data with its limitations. It is not legal, engineering, financial or investment advice. Requirements depend on the code edition your state and local fire marshal have adopted; confirm with your authority having jurisdiction.
Sources, ranked by quality
Tier 1: primary and official sources (22)
- [1] U.S. Bureau of Labor Statistics. Census of Fatal Occupational Injuries (CFOI) time series flat files, fw database. 2011-2022. Accessed 2026-10-27.
- [2] U.S. Bureau of Labor Statistics. National Census of Fatal Occupational Injuries in 2024 (news release, February 19, 2026). 2023-2024. Accessed 2026-10-27.
- [3] U.S. Bureau of Labor Statistics. CFOI Table A-1: Fatal occupational injuries by industry and event or exposure, 2024. 2024. Accessed 2026-10-27.
- [4] U.S. Bureau of Labor Statistics. CFOI Table A-5: Fatal occupational injuries by occupation and event or exposure, 2024. 2024. Accessed 2026-10-27.
- [5] U.S. Bureau of Labor Statistics. CFOI Table A-7: Fatal occupational injuries by worker characteristics and event or exposure, 2024. 2024. Accessed 2026-10-27.
- [6] U.S. Bureau of Labor Statistics. CFOI Table A-9: Fatal occupational injuries by event or exposure and industry sector, 2024. 2024. Accessed 2026-10-27.
- [7] U.S. Bureau of Labor Statistics. CFOI Table A-1: Fatal occupational injuries by industry and event or exposure, 2023. 2023. Accessed 2026-10-27.
- [8] U.S. Bureau of Labor Statistics. CFOI Table A-9: Fatal occupational injuries by event or exposure and industry sector, 2023. 2023. Accessed 2026-10-27.
- [9] U.S. Bureau of Labor Statistics. CFOI Table A-5: Fatal occupational injuries by occupation and event or exposure, 2023. 2023. Accessed 2026-10-27.
- [10] U.S. Bureau of Labor Statistics. CFOI tables index (current release). 2023-2024. Accessed 2026-10-27.
- [11] U.S. Bureau of Labor Statistics. CFOI archive: Tables A-1 and A-5, 2015-2022, and hours-based rate files, 2011-2022. 2011-2022. Accessed 2026-10-27.
- [12] U.S. Bureau of Labor Statistics. CFOI hours-based fatal injury rates by industry, occupation and worker characteristics, 2024. 2024. Accessed 2026-10-27.
- [13] U.S. Bureau of Labor Statistics. CFOI hours-based fatal injury rates, 2023. 2023. Accessed 2026-10-27.
- [14] U.S. Bureau of Labor Statistics. Occupational Injury and Illness Classification Manual (OIICS). 2011-2024. Accessed 2026-10-27.
- [15] U.S. Bureau of Labor Statistics. OIICS version 3: list of major changes. 2023. Accessed 2026-10-27.
- [16] U.S. Bureau of Labor Statistics. Survey of Occupational Injuries and Illnesses (SOII) case and demographic series, cs database (queried through BLS Public API v1). 2011-2020. Accessed 2026-10-27.
- [17] U.S. Bureau of Labor Statistics. SOII Table R64: DART, DAFW and DJTR cases by event or exposure and industry sector, private industry, 2023-2024. 2023-2024. Accessed 2026-10-27.
- [18] U.S. Bureau of Labor Statistics. SOII Table R70: cases by event or exposure and number of days away, private industry, 2023-2024. 2023-2024. Accessed 2026-10-27.
- [19] U.S. Bureau of Labor Statistics. Employer-Reported Workplace Injuries and Illnesses, 2023-2024 (news release, January 22, 2026). 2023-2024. Accessed 2026-10-27.
- [20] U.S. Bureau of Labor Statistics. BLS release schedule, December 2026. 2025. Accessed 2026-10-27.
- [21] U.S. Bureau of Labor Statistics. CFOI hours-based rates: concepts and methodology. methodology. Accessed 2026-10-27.
- [22] U.S. Bureau of Labor Statistics. CFOI news release Table 2: Fatal occupational injuries for selected events or exposures, 2023-24. 2023-2024. Accessed 2026-10-27.