Nursing Home Fire Safety Deficiencies: Most-Cited K-Tags and State Atlas (2026)
- Primary data
- CMS Provider Data Catalog: Fire Safety Deficiencies (ifjz-ge4w), with Provider Information, Inspection Dates and State US Averages
- Data period
- Last 3 inspection cycles per facility; survey dates 2016-07-28 to 2026-08-20 (cycle 1 median 2025-11-19)
- Latest release used
- 2026-10-08
- Next release
- 2026-10-28 (CMS nextUpdateDate)
- Geography
- United States, 50 states and DC (Puerto Rico and Guam in totals only)
- Sources
- 24 (21 Tier 1)
Sprinkler inspection, testing and maintenance (K353) is the most-cited of all nursing home fire safety deficiencies: 16,433 of 178,387 Life Safety Code citations (9.2%) in the September 2026 CMS file. Generator testing (K918) and fire alarm testing (K345) follow. Recent citation rates range from 8.43 per facility in New Mexico to 0.30 in Vermont.
Most common nursing home fire safety deficiencies: the national K-tag ranking
Citations are concentrated: 15 of 122 K-tags account for 63.8% of the 178,387 Life Safety Code citations, and the top 5 alone for 30.2%. Recurring testing and maintenance duties dominate the top of the list.
K-tag: A K-tag is the identification number CMS gives each Life Safety Code requirement on Form CMS-2786R, the Fire Safety Survey Report. K-tags cover the 2012 editions of NFPA 101 and NFPA 99 as adopted by CMS. E-tags are the separate emergency preparedness rules.
Share of 178,387 K citations, last 3 inspection cycles
Source: CMS Fire Safety Deficiencies (ifjz-ge4w), September 2026 file; analysis by Fire Life and Safety
| Rank | K-tag | Plain-language system | CMS category | Citations | Share of K citations (%) | Cumulative share (%) | Facilities cited | Share of all 14,690 facilities (%) |
|---|---|---|---|---|---|---|---|---|
| 1 | K0353 | Sprinkler inspection, testing and maintenance (NFPA 25) | Smoke Deficiencies | 16,433 | 9.2 | 9.2 | 9,737 | 66.3 |
| 2 | K0918 | Generator and essential electrical system testing (NFPA 99, NFPA 110) | Gas, Vacuum, and Electrical Systems Deficiencies | 11,246 | 6.3 | 15.5 | 7,537 | 51.3 |
| 3 | K0345 | Fire alarm testing and maintenance (NFPA 72) | Smoke Deficiencies | 9,069 | 5.1 | 20.6 | 6,435 | 43.8 |
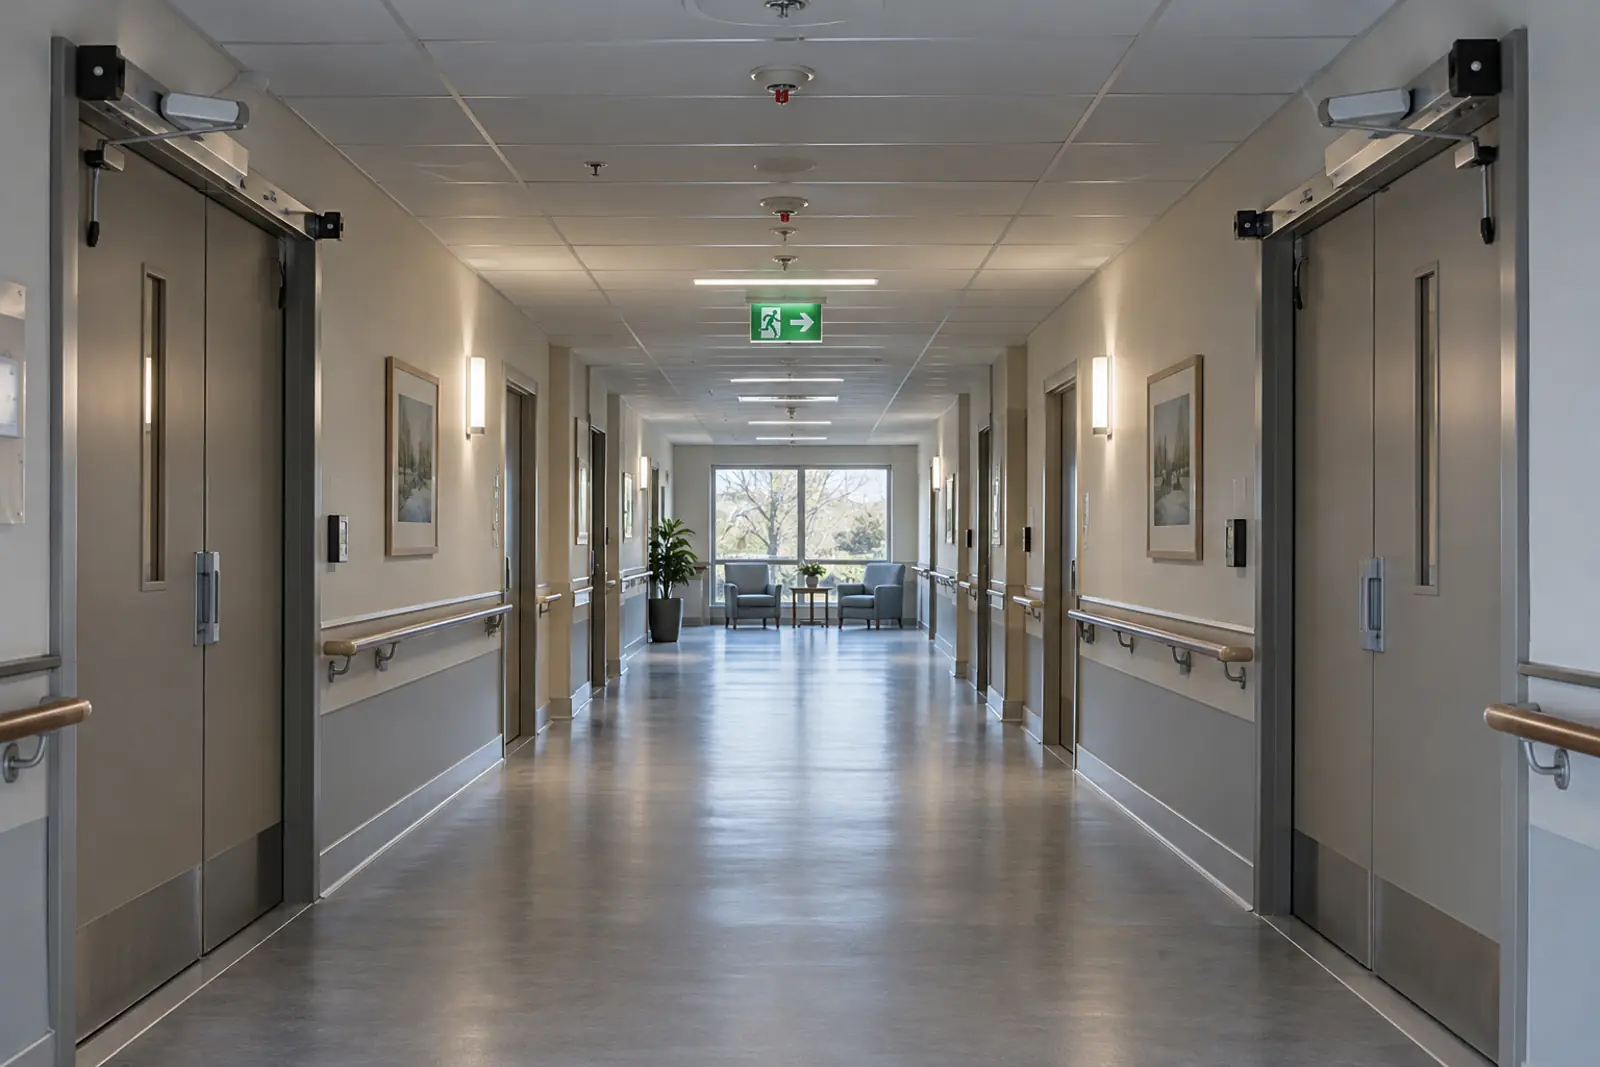
| 4 | K0363 | Corridor doors that resist smoke and latch | Smoke Deficiencies | 8,807 | 4.9 | 25.5 | 6,022 | 41.0 |
| 5 | K0321 | Hazardous room enclosure (storage, laundry, soiled linen rooms) | Smoke Deficiencies | 8,390 | 4.7 | 30.2 | 6,088 | 41.4 |
| 6 | K0712 | Fire drills held quarterly on each shift | Miscellaneous Deficiencies | 8,135 | 4.6 | 34.8 | 5,621 | 38.3 |
| 7 | K0920 | Power strips and extension cords | Gas, Vacuum, and Electrical Systems Deficiencies | 7,648 | 4.3 | 39.1 | 5,345 | 36.4 |
| 8 | K0324 | Kitchen cooking protection, hood and suppression (NFPA 96) | Smoke Deficiencies | 7,592 | 4.3 | 43.3 | 5,816 | 39.6 |
| 9 | K0372 | Smoke barrier walls and penetrations | Smoke Deficiencies | 5,925 | 3.3 | 46.7 | 4,583 | 31.2 |
| 10 | K0511 | Gas and electric utilities | Services Deficiencies | 5,699 | 3.2 | 49.9 | 4,230 | 28.8 |
| 11 | K0211 | Clear corridors, aisles and exits | Egress Deficiencies | 5,220 | 2.9 | 52.8 | 4,130 | 28.1 |
| 12 | K0222 | Egress door locking and release | Egress Deficiencies | 5,215 | 2.9 | 55.7 | 4,118 | 28.0 |
| 13 | K0923 | Medical gas cylinder storage | Gas, Vacuum, and Electrical Systems Deficiencies | 5,164 | 2.9 | 58.6 | 4,239 | 28.9 |
| 14 | K0355 | Portable fire extinguishers (NFPA 10) | Smoke Deficiencies | 4,689 | 2.6 | 61.2 | 3,798 | 25.9 |
| 15 | K0761 | Fire door annual inspection and testing (NFPA 80) | Miscellaneous Deficiencies | 4,649 | 2.6 | 63.8 | 3,750 | 25.5 |
Share of all facilities uses the 14,690 nursing homes in Provider Information. Plain-language names are ours; CMS descriptions are in the CSV source file.
Source: [1][2][8] Centers for Medicare & Medicaid Services; Centers for Medicare & Medicaid Services; Centers for Medicare & Medicaid Services
K353 sprinkler inspection, testing and maintenance leads with 16,433 citations, 9.2% of all K citations in the September 2026 CMS file. Form CMS-2786R ties K353 to NFPA 25 and to records of inspection and testing being readily available.
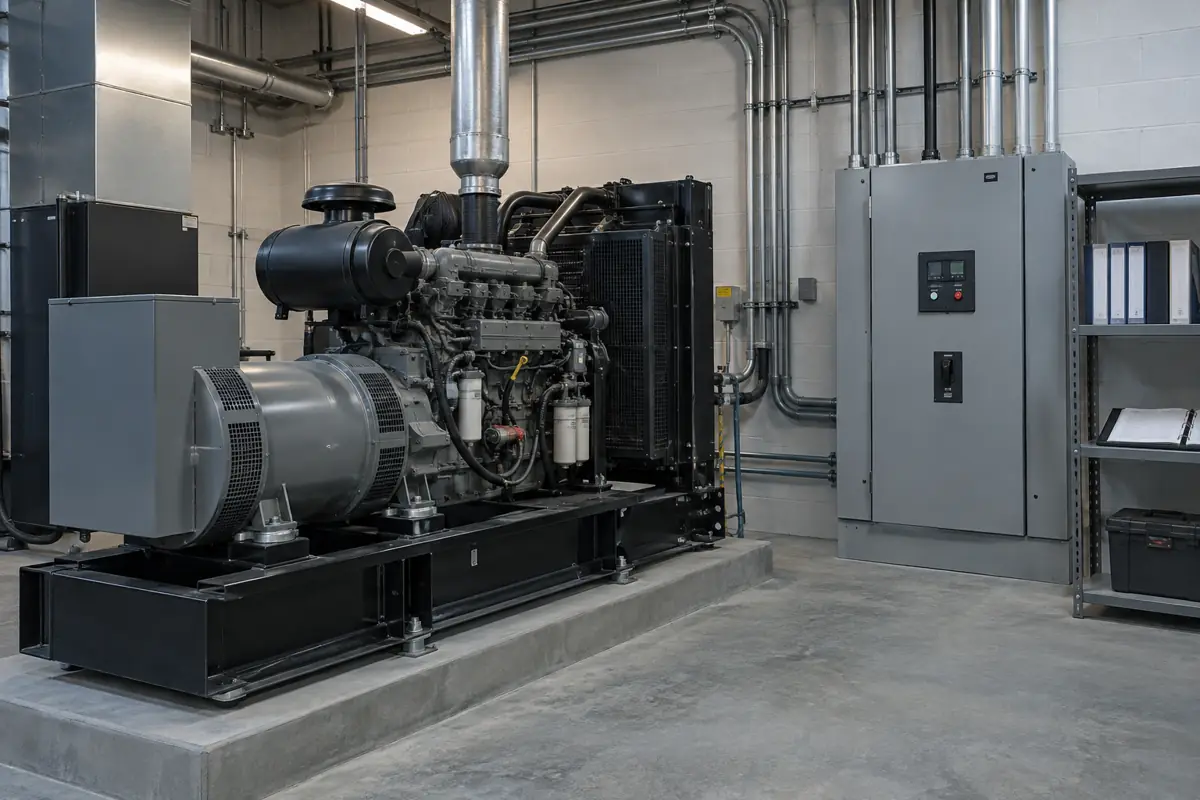
K918 generator and essential electrical system testing ranks second with 11,246 citations (6.3%). Form CMS-2786R describes K918 as a generator that supplies power within 10 seconds, maintained under NFPA 110, and exercised under load for 30 minutes 12 times a year.
K345 fire alarm testing and maintenance (9,069 citations, 5.1%), K363 corridor doors (8,807, 4.9%) and K321 hazardous room enclosures (8,390, 4.7%) complete the top 5. K712 fire drills (8,135, 4.6%) ranks sixth; CMS expects drills at least quarterly on each shift.
Which fire protection systems the citations point to
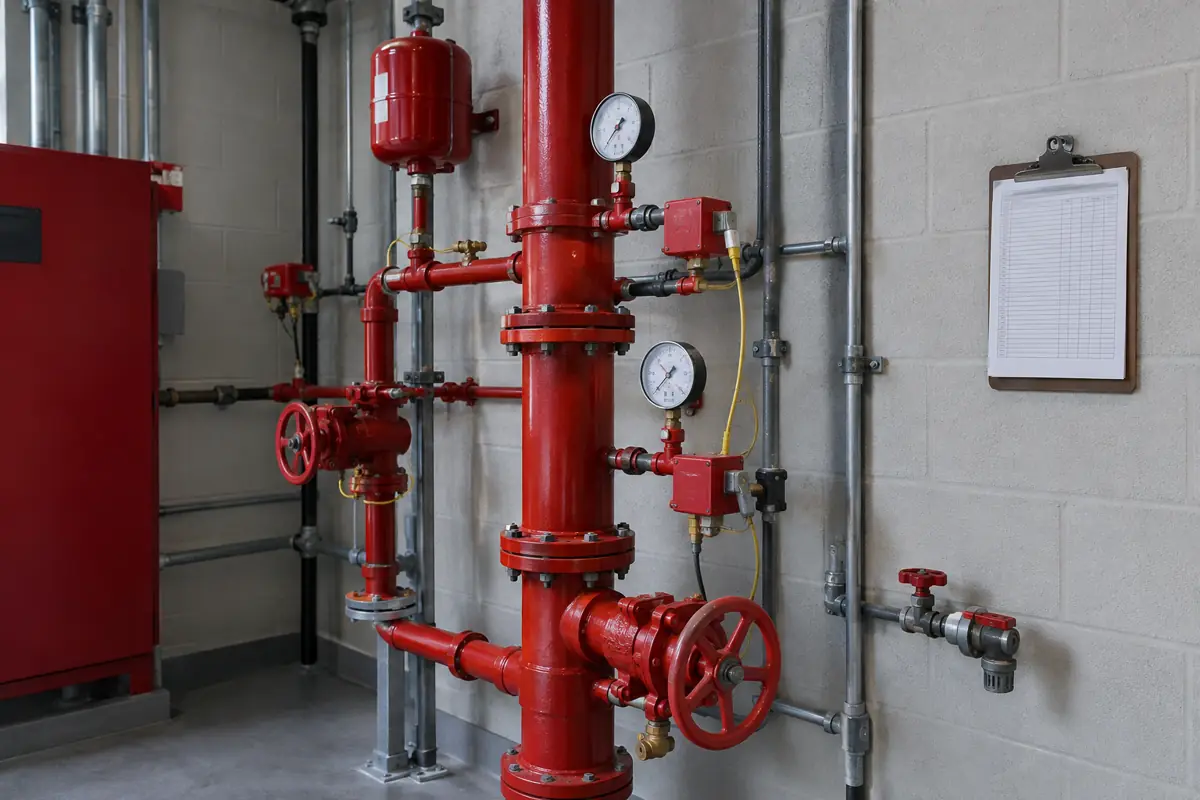
Grouping related K-tags into plain-language systems shows that sprinkler problems reach the most buildings: 71.3% of nursing homes were cited for at least one sprinkler tag in 3 cycles.
| System (plain language) | K-tags grouped | Citations | Share of K citations (%) | Facilities cited at least once | Share of all facilities (%) |
|---|---|---|---|---|---|
| Sprinkler systems (install, supervise, test, out of service) | K351 K352 K353 K354 | 21,783 | 12.2 | 10,467 | 71.3 |
| Fire and smoke doors (corridor, smoke barrier, hold-open, door testing) | K223 K363 K374 K761 | 18,928 | 10.6 | 9,060 | 61.7 |
| Smoke barriers, hazardous-area walls and vertical openings | K311 K321 K331 K362 K372 | 17,037 | 9.6 | 8,727 | 59.4 |
| Electrical cords, receptacles and equipment | K911 K912 K914 K919 K920 K921 | 16,132 | 9.0 | 8,023 | 54.6 |
| Fire alarm and smoke detection | K341 K342 K343 K344 K345 K346 K347 | 14,129 | 7.9 | 7,970 | 54.3 |
| Exit access and egress doors | K211 K222 K225 K232 K271 | 13,645 | 7.6 | 7,507 | 51.1 |
| Generator and essential electrical system | K918 | 11,246 | 6.3 | 7,537 | 51.3 |
| Fire drills and evacuation plans | K711 K712 | 9,894 | 5.5 | 6,183 | 42.1 |
| Emergency lighting and exit signs | K281 K291 K293 | 8,069 | 4.5 | 5,213 | 35.5 |
| Kitchen cooking protection (hood and suppression) | K324 | 7,592 | 4.3 | 5,816 | 39.6 |
| Medical gas and oxygen storage and handling | K922 K923 K925 K926 K927 K929 | 6,843 | 3.8 | 5,131 | 34.9 |
| Portable fire extinguishers | K355 | 4,689 | 2.6 | 3,798 | 25.9 |
Grouping by Fire Life and Safety. A facility counts once per system even if cited for several tags.
Source: [1][2] Centers for Medicare & Medicaid Services; Centers for Medicare & Medicaid Services
Last 3 inspection cycles, 14,690 facilities
Source: CMS Fire Safety Deficiencies and Provider Information, September 2026 files; grouping by Fire Life and Safety
Sprinkler tags (K351 to K354) total 21,783 citations, 12.2% of all K citations. Inspection frequencies and what a sprinkler visit covers are on our fire sprinkler inspection page.
Fire alarm and smoke detection tags reached 54.3% of facilities in 3 cycles; see fire alarm inspection for the testing schedule under NFPA 72 as adopted by your state.
Kitchen cooking protection (K324, NFPA 96) was cited at 39.6% of facilities, emergency lighting and exit signs at 35.5%, and portable extinguishers (K355, NFPA 10) at 25.9%. Related pages: kitchen hood suppression, emergency lighting and fire extinguishers.
Fire and smoke doors (61.7% of facilities) and smoke barriers with hazardous-room walls (59.4%) are building-envelope items rather than equipment. K761 adds a paperwork duty: fire door assemblies inspected and tested annually under NFPA 80. The healthcare buildings guide summarizes which systems apply to nursing homes.
How serious the citations are: scope and severity in plain words
Almost every Life Safety Code citation is graded as a potential, not actual, harm. 96.45% of K citations are severity level 2, and the most common single code is F: widespread potential for more than minimal harm.
Scope and severity code: CMS grades each citation on a 12-cell grid in State Operations Manual Chapter 7. Severity runs from level 1 (no actual harm, potential for minimal harm) to level 4 (immediate jeopardy). Scope is isolated, pattern or widespread. Letters A to C are level 1, D to F level 2, G to I level 3 (actual harm) and J to L level 4, each row ordered isolated, pattern, widespread.
Share of K citations by CMS code (B to L; no A codes)
Source: CMS Fire Safety Deficiencies (ifjz-ge4w), September 2026 file; grid per SOM Chapter 7
| Code | Severity | Scope | K citations | Share (%) |
|---|---|---|---|---|
| A | Level 1: no actual harm, potential for minimal harm | Isolated | 0 | 0.0 |
| B | Level 1: no actual harm, potential for minimal harm | Pattern | 510 | 0.29 |
| C | Level 1: no actual harm, potential for minimal harm | Widespread | 5,631 | 3.16 |
| D | Level 2: no actual harm, potential for more than minimal harm | Isolated | 49,595 | 27.8 |
| E | Level 2: no actual harm, potential for more than minimal harm | Pattern | 56,339 | 31.58 |
| F | Level 2: no actual harm, potential for more than minimal harm | Widespread | 66,122 | 37.07 |
| G | Level 3: actual harm, not immediate jeopardy | Isolated | 4 | 0.0 |
| H | Level 3: actual harm, not immediate jeopardy | Pattern | 1 | 0.0 |
| I | Level 3: actual harm, not immediate jeopardy | Widespread | 1 | 0.0 |
| J | Level 4: immediate jeopardy | Isolated | 20 | 0.01 |
| K | Level 4: immediate jeopardy | Pattern | 46 | 0.03 |
| L | Level 4: immediate jeopardy | Widespread | 118 | 0.07 |
Grid definitions from SOM Chapter 7, Rev. 244.
Source: [1][6] Centers for Medicare & Medicaid Services; Centers for Medicare & Medicaid Services
Widespread scope accounts for 40.3% of K citations, pattern for 31.9% and isolated for 27.8%. A building-wide problem such as a missed sprinkler test reads as widespread because it affects every resident, which explains why code F alone holds 37.07%.
Only 6 K citations were graded actual harm (G to I). 184 were immediate jeopardy (J to L), 0.1% of the total; egress door locking (K222, 32), means of egress (K211, 21), fire alarm testing (K345, 18) and fire alarm out of service (K346, 13) lead that group.
State atlas: fire safety citations per nursing home
In the most recent inspection cycle, K citations per facility range from 8.43 in New Mexico to 0.30 in Vermont. The 28.1-fold spread is too large to be explained by building age alone and likely also reflects how state survey agencies inspect and record.
Cycle 1 Life Safety Code citations divided by facilities
Source: CMS Fire Safety Deficiencies and Provider Information, September 2026 files
Show all 51 rows
| Rank | State | Code | Facilities | K citations, cycle 1 | K citations per facility, cycle 1 | Facilities with 1+ K citation, cycle 1 (%) | K citations per facility, 3 cycles | Most-cited K-tag | CMS state average, fire safety + EP, cycle 1 |
|---|---|---|---|---|---|---|---|---|---|
| 1 | New Mexico | NM | 68 | 573 | 8.43 | 91.2 | 15.72 | K324 | 9.8 |
| 2 | Maryland | MD | 221 | 1,819 | 8.23 | 95.0 | 22.23 | K353 | 8.7 |
| 3 | Kansas | KS | 296 | 2,419 | 8.17 | 99.0 | 25.28 | K353 | 8.9 |
| 4 | Washington | WA | 193 | 1,419 | 7.35 | 99.0 | 23.59 | K353 | 10.1 |
| 5 | Nevada | NV | 66 | 437 | 6.62 | 100.0 | 20.39 | K353 | 8.8 |
| 6 | New Jersey | NJ | 348 | 2,207 | 6.34 | 95.1 | 15.39 | K353 | 6.7 |
| 7 | Wyoming | WY | 36 | 206 | 5.72 | 91.7 | 14.56 | K345 | 6.5 |
| 8 | Colorado | CO | 210 | 1,198 | 5.7 | 79.5 | 15.38 | K353 | 5.9 |
| 9 | California | CA | 1165 | 6,581 | 5.65 | 98.8 | 17.47 | K353 | 6.3 |
| 10 | Missouri | MO | 487 | 2,600 | 5.34 | 93.0 | 17.63 | K353 | 6.0 |
| 11 | New York | NY | 593 | 3,128 | 5.27 | 90.6 | 14.28 | K353 | 5.7 |
| 12 | Ohio | OH | 922 | 4,835 | 5.24 | 92.5 | 16.83 | K353 | 5.5 |
| 13 | Maine | ME | 78 | 408 | 5.23 | 96.2 | 15.27 | K211 | 6.3 |
| 14 | Wisconsin | WI | 323 | 1,653 | 5.12 | 95.4 | 17.18 | K353 | 5.7 |
| 15 | Montana | MT | 61 | 305 | 5.0 | 86.9 | 14.54 | K353 | 5.7 |
| 16 | Nebraska | NE | 180 | 885 | 4.92 | 95.6 | 15.47 | K321 | 5.2 |
| 17 | Indiana | IN | 507 | 2,478 | 4.89 | 86.4 | 14.45 | K353 | 5.6 |
| 18 | Illinois | IL | 666 | 2,995 | 4.5 | 71.3 | 13.54 | K353 | 5.5 |
| 19 | Michigan | MI | 422 | 1,779 | 4.22 | 86.7 | 13.67 | K353 | 4.8 |
| 20 | Connecticut | CT | 191 | 774 | 4.05 | 75.4 | 10.98 | K353 | 4.3 |
| 21 | Minnesota | MN | 338 | 1,331 | 3.94 | 89.9 | 12.52 | K353 | 4.0 |
| 22 | North Carolina | NC | 419 | 1,650 | 3.94 | 92.6 | 11.1 | K918 | 4.0 |
| 23 | Alaska | AK | 20 | 77 | 3.85 | 80.0 | 12.95 | K353 | 5.0 |
| 24 | Massachusetts | MA | 341 | 1,172 | 3.44 | 72.4 | 9.74 | K918 | 4.0 |
| 25 | Alabama | AL | 224 | 761 | 3.4 | 76.3 | 9.5 | K353 | 3.6 |
| 26 | Iowa | IA | 387 | 1,255 | 3.24 | 85.5 | 11.32 | K353 | 3.6 |
| 27 | Georgia | GA | 356 | 1,133 | 3.18 | 78.4 | 9.21 | K353 | 3.3 |
| 28 | Pennsylvania | PA | 656 | 2,045 | 3.12 | 71.8 | 10.47 | K353 | 3.5 |
| 29 | Tennessee | TN | 303 | 912 | 3.01 | 80.2 | 7.89 | K353 | 3.6 |
| 30 | Idaho | ID | 80 | 230 | 2.88 | 77.5 | 7.88 | K353 | 3.5 |
| 31 | Texas | TX | 1177 | 3,390 | 2.88 | 82.7 | 8.04 | K353 | 3.1 |
| 32 | Kentucky | KY | 267 | 753 | 2.82 | 76.4 | 8.75 | K920 | 3.0 |
| 33 | Oregon | OR | 128 | 357 | 2.79 | 91.4 | 10.23 | K712 | 3.5 |
| 34 | New Hampshire | NH | 73 | 185 | 2.53 | 79.5 | 7.63 | K918 | 2.7 |
| 35 | West Virginia | WV | 123 | 306 | 2.49 | 75.6 | 8.32 | K353 | 2.7 |
| 36 | Virginia | VA | 289 | 702 | 2.43 | 70.6 | 10.26 | K353 | 2.7 |
| 37 | Oklahoma | OK | 283 | 667 | 2.36 | 79.9 | 7.78 | K321 | 2.4 |
| 38 | Florida | FL | 694 | 1,620 | 2.33 | 73.1 | 6.69 | K353 | 2.8 |
| 39 | Hawaii | HI | 43 | 99 | 2.3 | 55.8 | 4.84 | K761 | 2.4 |
| 40 | Arizona | AZ | 140 | 298 | 2.13 | 72.9 | 7.36 | K363 | 2.8 |
| 41 | Arkansas | AR | 221 | 427 | 1.93 | 67.9 | 5.47 | K347 | 2.0 |
| 42 | District of Columbia | DC | 17 | 29 | 1.71 | 70.6 | 4.88 | K363 | 1.8 |
| 43 | Rhode Island | RI | 72 | 110 | 1.53 | 56.9 | 5.46 | K918 | 1.8 |
| 44 | Utah | UT | 97 | 148 | 1.53 | 43.3 | 5.26 | K321 | 1.9 |
| 45 | North Dakota | ND | 72 | 83 | 1.15 | 48.6 | 3.39 | K918 | 1.2 |
| 46 | South Dakota | SD | 96 | 107 | 1.11 | 53.1 | 3.53 | K712 | 1.3 |
| 47 | Louisiana | LA | 265 | 227 | 0.86 | 38.1 | 2.75 | K521 | 0.9 |
| 48 | Delaware | DE | 44 | 21 | 0.48 | 20.5 | 2.73 | K353 | 0.5 |
| 49 | South Carolina | SC | 187 | 89 | 0.48 | 23.0 | 1.79 | K353 | 0.5 |
| 50 | Mississippi | MS | 202 | 75 | 0.37 | 26.7 | 1.25 | K918 | 0.4 |
| 51 | Vermont | VT | 33 | 10 | 0.3 | 24.2 | 2.7 | K353 | 0.7 |
Ranked by cycle 1 rate. CMS column is CMS's published average for fire safety plus emergency preparedness citations.
Source: [1][2][4] Centers for Medicare & Medicaid Services; Centers for Medicare & Medicaid Services; Centers for Medicare & Medicaid Services
Cycle 1 is each facility's most recent fire safety standard survey plus complaint surveys of the last 12 months. CMS describes the cycle structure in its Nursing Home Data Dictionary. Facility counts come from the Provider Information file (14,690 nursing homes).
New Mexico (8.43), Maryland (8.23), Kansas (8.17), Washington (7.35) and Nevada (6.62) have the highest rates. Louisiana (0.86), Delaware (0.48), South Carolina (0.48), Mississippi (0.37) and Vermont (0.30) have the lowest.
K353 is the most-cited tag in 31 of 51 jurisdictions. Where it is not, the leader is usually K918 generator testing. New Mexico, the highest-rate state, is led by K324 kitchen cooking protection.
State fire code adoption differs too, but CMS surveys nursing homes against the 2012 editions of NFPA 101 and NFPA 99 regardless of the state code, so the K-tag counts here are measured against one federal standard.
Correction status, complaint citations and disputes
Nearly all K citations are closed with a correction date, and almost none come from complaints. Fire safety citations are found on scheduled recertification surveys.
| Field | Value | K citations | Share of K citations (%) |
|---|---|---|---|
| Correction status | Deficient, Provider has date of correction | 172,936 | 96.9 |
| Correction status | Waiver has been granted | 2,627 | 1.5 |
| Correction status | Deficient, Provider has plan of correction | 1,517 | 0.9 |
| Correction status | Deficient, Provider has no plan of correction | 678 | 0.4 |
| Correction status | No revisit needed | 291 | 0.2 |
| Correction status | Fire Safety Evaluation Survey | 230 | 0.1 |
| Correction status | Past Non-Compliance | 108 | 0.1 |
| Origin | Found on a standard (recertification) survey | 177,094 | 99.3 |
| Origin | Found on a complaint survey | 1,345 | 0.8 |
| Dispute | Under informal dispute resolution (IDR) | 34 | 0.02 |
| Dispute | Under independent IDR (IIDR) | 1 | 0.001 |
52 citations are flagged as both standard and complaint.
Source: [1] Centers for Medicare & Medicaid Services
96.9% of K citations (172,936) show a correction date. 2,627 citations (1.5%) are listed as waivers granted, which 42 CFR 483.90 allows when a provision would cause unreasonable hardship without harming residents. 678 citations (0.4%) show no plan of correction yet.
Standard surveys account for 99.3% of K citations and complaint surveys for 0.8%; 52 rows carry both flags. Only 34 K citations were under informal dispute resolution in the September 2026 file.
Trend by survey year, and how far back the data goes
The file keeps each facility's last 3 inspection cycles, not fixed calendar years. Measured per standard survey, the K citation rate held between 3.34 and 4.35 from 2019 to 2026.
Standard-survey K citations / fire safety standard surveys in the file
Source: CMS Fire Safety Deficiencies and Inspection Dates, September 2026 files
| Survey year | K citations in file | E citations in file | Fire safety standard surveys in file | K citations per standard survey |
|---|---|---|---|---|
| 2019 | 6,797 | 920 | 1,773 | 3.83 |
| 2020 | 2,378 | 296 | 711 | 3.34 |
| 2021 | 7,075 | 909 | 1,950 | 3.63 |
| 2022 | 16,276 | 2,076 | 3,739 | 4.35 |
| 2023 | 34,268 | 4,260 | 8,182 | 4.17 |
| 2024 | 46,929 | 6,045 | 11,148 | 4.17 |
| 2025 | 39,454 | 4,700 | 9,756 | 4.0 |
| 2026 | 23,835 | 2,367 | 6,241 | 3.77 |
2026 runs through 2026-08-20. Years before 2023 are incomplete by design.
Source: [1][3] Centers for Medicare & Medicaid Services; Centers for Medicare & Medicaid Services
Survey dates in the file run from 2016-07-28 to 2026-08-20. Cycle 1 standard surveys have a median date of 2025-11-19, and 85.1% are dated 2025 or later; cycle 3 surveys have a median date of 2023-03-09.
Years before 2023 are thin because only surveys that are still among a facility's last 3 cycles remain; a facility surveyed rarely keeps older dates. Raw citation counts by year therefore cannot be read as a trend. The per-survey rate in the last column is the fairer comparison, and it moved from 4.35 in 2022 to 4.17 in 2023 and 2024, 4.0 in 2025 and 3.77 in 2026 to date.
How this ranking compares with earlier counts
Earlier tabulations agree on the leaders: sprinkler testing and generator testing top the AHCA national list for fiscal year 2023, and the HHS OIG found life safety gaps at 150 of 154 homes it visited.
The American Health Care Association's tabulation of CMS QCOR data for federal fiscal year 2023 also ranks K353 first (4,188 citations, 25.70% of providers) and K918 second (3,209). Our 3-cycle window yields 66.3% of providers cited for K353, 2.6 times the one-year share, because a 3-cycle window gives each facility three surveys to be cited.
LeadingAge New York's list of New York state tags for 2016-11-01 to 2018-07-11 was led by K351 sprinkler installation (229 citations). LeadingAge Minnesota listed K353, K712 and K345 as the top Minnesota life safety tags for fiscal year 2021, without counts.
The HHS OIG's July 2022 summary of audits in 8 states found 2,233 areas of noncompliance at 150 of 154 nursing homes visited unannounced: 1,094 life safety and 1,139 emergency preparedness. Exits, fire barriers and smoke partitions accounted for 416 of the life safety findings and fire detection and suppression for 268.
The sprinkler mandate itself is recent history. GAO reported in 2004 that 31 residents died in 2003 nursing home fires in Hartford, Connecticut and Nashville, Tennessee, in homes that federal standards did not require to be sprinklered. 42 CFR 483.90 now requires sprinklers throughout by 2013-08-13, and 14,605 facilities in the Provider Information file are flagged as sprinklered in all required areas, with 36 flagged partial.
The rules behind the K-tags
Nursing homes in Medicare or Medicaid must meet the Life Safety Code under 42 CFR 483.90, surveyed by state agencies on CMS's behalf. The results are public but do not affect the Five-Star rating.
- 42 CFR 483.90 requires long-term care facilities to meet NFPA 101 with listed tentative interim amendments, and the 2016 final rule (81 FR 26872) adopted the 2012 edition effective 2016-07-05.
- State Operations Manual Appendix I directs that Life Safety Code surveys be unannounced and use the 2012 editions of NFPA 101 and NFPA 99.
- SOM Chapter 7 requires a standard survey no later than 15 months after the previous one, with a statewide average of no more than 12 months.
- CMS's Five-Star Technical Users' Guide (September 2026) states that deficiencies from Life Safety surveys are not included in the Five-Star rating calculations.
- This report summarizes requirements and is not legal or compliance advice; editions and local amendments vary as adopted by your state.
Data quality notes
The file is clean at the row level: no duplicates and no missing states. The main cautions are the mixed K and E tags, the cycle-based window and broad CMS category labels.
- Completeness: 134 API pages returned 200,188 rows, equal to the API count and to the bulk CSV; Provider Information returned 14,690 rows and Inspection Dates 149,330 rows, each equal to its API count.
- Duplicates: 0 exact duplicate rows and 0 repeated facility, survey date and tag combinations.
- Mixed rule sets: 21,801 rows (10.9%) are E-tag emergency preparedness citations. This report ranks K-tags only; CMS's published state averages include both.
- Geography: no blank states. Puerto Rico (270 rows, 9 facilities) and Guam (20 rows, 1 facility) are in national totals but left out of the state ranking because of small counts.
- Inspection cycle: cycle 1 is the most recent standard survey; standard cycles count back survey by survey, complaint cycles count back by year, and a citation found on a combined standard and complaint survey is assigned to the standard cycle (CMS data dictionary).
- Tag versions: every row is tagged New, meaning post-2016-07-05 K-tag definitions; no pre-2016 definitions remain.
- Text quirks: CMS's K355 description reads "fire extinguishes"; CMS files most fire protection tags under "Smoke Deficiencies".
- Validation: recomputed K plus E citations per facility in cycle 1 match the CMS State US Averages file for all 51 jurisdictions after rounding (national 4.46 vs CMS 4.5).
State-by-state findings
- New Mexico has the highest rate: 8.43 K citations per nursing home in the most recent inspection cycle, across 68 facilities (CMS, September 2026 file).[1][2]
- Maryland (8.23) and Kansas (8.17) are the only other states above 8 K citations per facility in the most recent cycle.[1][2]
- Vermont (0.30), Mississippi (0.37), South Carolina (0.48) and Delaware (0.48) have the lowest rates, each under 0.5 K citations per facility in the most recent cycle.[1][2]
- The median state records 3.24 K citations per facility in the most recent cycle, below the national figure of 4.02 because large states such as California (5.65) and Ohio (5.24) sit above the median.[1][2]
- K353 sprinkler inspection, testing and maintenance is the most-cited K-tag in 31 of 51 jurisdictions (50 states and DC).[1]
- 66.3% of the 14,690 nursing homes in the September 2026 CMS file were cited for K353 at least once in their last 3 inspection cycles.[1][2]
- In Kansas and Washington, 99.0% of facilities received at least one K citation in the most recent cycle; in Delaware the share was 20.5%.[1][2]
- Nationally, 81.4% of nursing homes (11,953) received at least one K citation in the most recent cycle, and 18.8% of cycle 1 fire safety standard surveys found no K deficiency.[1][3]
- K918 generator and essential electrical system testing is the second most-cited K-tag nationally (11,246 citations, 6.3%) and cited at 51.3% of facilities in 3 cycles.[1][2]
- Egress door locking (K222, 32 citations) and blocked means of egress (K211, 21 citations) are the K-tags most often cited at immediate jeopardy level.[1]
- 99.3% of K citations come from standard recertification surveys; 0.8% come from complaint surveys.[1]
- 96.9% of K citations carry a correction date; 1.5% (2,627) are listed as waivers granted, and 678 citations (0.4%) show no plan of correction yet.[1]
Rankings and ratios we derived
Top-15 concentration
Formulacitations of the 15 most-cited K-tags / all K citations
Inputs: row 2; table t1 (fact sheet rows)
Result: 63.8% (top 5: 30.2%)
A short list of 15 requirements produces most citations, so a facility checklist built on them covers the bulk of what surveyors cite.
Limitations: Counts citations, not distinct problems; a single tag can describe several findings in one survey.
Inspection, testing, maintenance and drill (ITM) share
Formulacitations of K353, K918, K345, K712, K761, K355 / all K citations
Inputs: row 2; table t1; derived d5, d6 (fact sheet rows)
Result: 30.4% of K citations (54,221); 83.8% of facilities (12,313) cited for at least one in 3 cycles
Nearly a third of Life Safety Code citations concern recurring duties and their records rather than building construction.
Limitations: Grouping is ours. K355 also covers extinguisher selection and placement; K918 includes equipment conditions as well as test records.
State rate per facility, most recent cycle
Formulacycle 1 K citations in state / facilities in Provider Information
Inputs: rows 13, 34, 75 to 84; table t4 (fact sheet rows)
Result: Median state 3.24; highest New Mexico 8.43; lowest Vermont 0.30; ratio 28.1
States differ more than building stock alone would suggest, which points to survey practice as part of the explanation.
Limitations: Small states (Vermont 33 facilities, DC 17) move with a few citations; rates are per facility, not per bed.
Validation against CMS published state averages
Formulacount of states where recomputed (K + E) cycle 1 citations per facility equals the CMS State US Averages value within 0.05
Inputs: rows 43, 86; table t4 (fact sheet rows)
Result: 51 of 51 jurisdictions match
The download is complete and the per-facility method reproduces CMS's own figures.
Limitations: CMS publishes one decimal place, so small differences are hidden.
Clean-survey share
Formulacycle 1 fire safety standard surveys with no K citation / all cycle 1 fire safety standard surveys
Inputs: rows 37, 38 (fact sheet rows)
Result: 18.8% (2,759 of 14,687)
About 1 in 5 recent fire safety surveys found no Life Safety Code deficiency.
Limitations: Some of these surveys had E-tag citations.
K citations per standard survey by year
Formulastandard-survey K citations dated in year / fire safety standard surveys dated in year
Inputs: table t6 (fact sheet rows)
Result: 3.34 to 4.35 for 2019 to 2026
No sustained rise or fall; 2026 to date (3.77) is the lowest since 2020.
Limitations: Pre-2023 years hold only surveys still within a facility's last 3 cycles; 2026 is partial.
Executive summary
- The CMS Fire Safety Deficiencies file released 2026-10-08 holds 200,188 citations; 178,387 are Life Safety Code K-tags and 21,801 are emergency preparedness E-tags.
- K353 sprinkler inspection, testing and maintenance is the most-cited K-tag nationally, with 16,433 citations (9.2%) across the last 3 inspection cycles.
- Six recurring inspection, testing, maintenance and drill tags (K353, K918, K345, K712, K761, K355) account for 30.4% of all K citations, and 83.8% of the 14,690 nursing homes were cited for at least one of them.
- 96.45% of K citations sit at severity level 2: no actual harm, but potential for more than minimal harm. 184 citations (0.1%) were immediate jeopardy.
- The most recent inspection cycle averages 4.02 K citations per facility nationally; state rates run from 8.43 in New Mexico to 0.30 in Vermont, a 28.1-fold gap.
- Our recomputed state rates (K plus E tags) match the averages CMS publishes for all 51 jurisdictions, which confirms the file was pulled and counted completely.
- K citations per fire safety standard survey stayed between 3.34 and 4.35 for survey years 2019 to 2026, with no clear upward or downward trend.
Questions people ask
What is the most common life safety code citation in nursing homes?
K353, sprinkler system inspection, testing and maintenance. It accounts for 16,433 of 178,387 K citations (9.2%) in the September 2026 CMS file and was cited at 66.3% of U.S. nursing homes in their last 3 inspection cycles.
What are life safety code deficiencies?
They are findings that a facility does not meet a Life Safety Code requirement on Form CMS-2786R, recorded as K-tags. CMS enforces the 2012 editions of NFPA 101 and NFPA 99 for nursing homes under 42 CFR 483.90.
How often are nursing homes inspected for fire safety?
A standard survey is due no later than 15 months after the previous one, and each state's average interval may not exceed 12 months (SOM Chapter 7). 85.1% of the most recent fire safety standard surveys in the CMS file are dated 2025 or later.
Do fire safety deficiencies affect a nursing home's star rating?
No. CMS's Five-Star Technical Users' Guide (September 2026) states that Life Safety survey deficiencies are not included in the Five-Star rating calculations. They are shown separately on Care Compare.
Download the data
Every table in this report is available as a CSV under CC BY 4.0. The fact sheet lists each value with its source URL and access date.
- derived_metrics.csv (CSV)
- fact_sheet.csv (CSV)
- t1_top15_k_tags.csv (CSV)
- t2_system_groups.csv (CSV)
- t3_scope_severity.csv (CSV)
- t4_state_atlas.csv (CSV)
- t5_status_origin.csv (CSV)
- t6_by_survey_year.csv (CSV)
For journalists and researchers
If you cite only a few, cite these
- K353 sprinkler inspection, testing and maintenance: 16,433 citations, 9.2% of 178,387 K citations, U.S. nursing homes, last 3 inspection cycles (CMS, September 2026).[1]
- U.S. nursing homes averaged 4.02 Life Safety Code citations per facility in the most recent inspection cycle (CMS, September 2026).[1][2]
- State rates range from 8.43 K citations per facility in New Mexico to 0.30 in Vermont, most recent cycle (CMS, September 2026).[1][2]
Most quotable statistics
- Sprinkler inspection, testing and maintenance (K353) is the most-cited Life Safety Code deficiency in U.S. nursing homes: 16,433 citations, 9.2% of 178,387 K citations in the September 2026 CMS file.[1]
- 66.3% of the 14,690 U.S. nursing homes were cited for K353 sprinkler testing and maintenance at least once in their last 3 CMS inspection cycles.[1][2]
- Six recurring testing, maintenance and drill tags account for 30.4% of all Life Safety Code citations in U.S. nursing homes (CMS, September 2026).[1]
- New Mexico nursing homes averaged 8.43 Life Safety Code citations per facility in the most recent cycle, 28.1 times Vermont's 0.30 (CMS, September 2026).[1][2]
- 81.4% of U.S. nursing homes received at least one Life Safety Code citation in their most recent inspection cycle (CMS, September 2026).[1][2]
- 96.45% of nursing home Life Safety Code citations are graded no actual harm with potential for more than minimal harm; 184 (0.1%) were immediate jeopardy (CMS, September 2026).[1][6]
Press summary
Sprinkler testing and maintenance is the most common fire safety deficiency in U.S. nursing homes, according to a Fire Life and Safety analysis of all 200,188 rows in the CMS Fire Safety Deficiencies file released 2026-10-08. Of 178,387 Life Safety Code (K-tag) citations, K353 sprinkler inspection, testing and maintenance accounts for 16,433 (9.2%), followed by generator testing (K918) and fire alarm testing (K345). Fifteen tags make up 63.8% of all citations, and six recurring testing, maintenance and drill duties make up 30.4%. In the most recent inspection cycle, U.S. nursing homes averaged 4.02 K citations each, and 81.4% received at least one. State rates range from 8.43 per facility in New Mexico to 0.30 in Vermont. Almost all citations (96.45%) are graded as potential rather than actual harm; 184 were immediate jeopardy. The recomputed state averages match CMS's published figures for all 51 jurisdictions. Data, tables and code are published under CC BY 4.0.
Suggested headlines
- Sprinkler testing tops nursing home fire safety citations, CMS data show
- Two in three U.S. nursing homes cited for sprinkler upkeep in their last 3 inspections
- New Mexico, Maryland and Kansas lead nursing home fire safety citation rates
- Testing and paperwork drive 30.4% of nursing home Life Safety Code citations
- Nursing home fire safety citations: 28.1-fold gap between highest and lowest states
How to cite this report
Fire Life and Safety. (2026). Nursing Home Fire Safety Deficiencies: Most-Cited K-Tags and State Atlas (2026). Retrieved from https://firelifeandsafety.com/reports/nursing-home-fire-safety-deficiencies/
Reuse license
Data and tables are licensed CC BY 4.0. Attribution: “Source: Fire Life and Safety, Nursing Home Fire Safety Deficiencies: Most-Cited K-Tags and State Atlas (2026)” with a link to this page.
Frequently asked questions
How many fire safety citations are in the CMS nursing home file?
The September 2026 CMS Fire Safety Deficiencies file holds 200,188 citations: 178,387 Life Safety Code K-tags and 21,801 emergency preparedness E-tags, covering each facility's last 3 inspection cycles.
What share of nursing homes get at least one fire safety citation?
81.4% of U.S. nursing homes (11,953 of 14,690) received at least one K citation in their most recent inspection cycle, based on the September 2026 CMS files.
How many K citations does a typical nursing home receive per inspection?
The U.S. average is 3.99 K citations per cycle 1 fire safety standard survey and 4.02 K citations per facility in cycle 1, which also counts complaint surveys.
Which state has the most fire safety deficiencies per nursing home?
New Mexico, with 8.43 K citations per facility in the most recent cycle, followed by Maryland (8.23) and Kansas (8.17), per the September 2026 CMS files.
Which state has the fewest?
Vermont, with 0.30 K citations per facility in the most recent cycle, followed by Mississippi (0.37), South Carolina (0.48) and Delaware (0.48). Low rates may reflect survey practice as well as building conditions.
How many fire safety citations are immediate jeopardy?
184 K citations (0.1%) in the September 2026 file are immediate jeopardy (codes J, K or L). 96.45% are severity level 2, with no actual harm but potential for more than minimal harm.
Why is generator testing cited so often?
K918 is the second most-cited K-tag nationally (11,246 citations, 6.3%). Form CMS-2786R expects the generator to supply power within 10 seconds and to be exercised under load for 30 minutes 12 times a year under NFPA 110, so missing test records lead to citations.
How often must nursing homes hold fire drills?
Form CMS-2786R (K712) expects fire drills at least quarterly on each shift, at expected and unexpected times. K712 is the sixth most-cited K-tag, with 8,135 citations (4.6%).
Are most fire safety citations corrected?
Yes. 96.9% of K citations in the September 2026 file carry a correction date; 1.5% are waivers granted and 0.4% (678) show no plan of correction yet.
Are fire safety deficiencies rising?
Not clearly. K citations per fire safety standard survey ranged from 3.34 to 4.35 for survey years 2019 to 2026, and 2026 to date averages 3.77.
Methodology
Selection: the primary source is the CMS Provider Data Catalog Fire Safety Deficiencies dataset (ifjz-ge4w), the most recent release (modified 2026-09-30, released 2026-10-08, processing date 2026-09-01). We downloaded every row through the datastore query API in pages of 1,500 (134 pages) using offsets, logged the row count of each page, and confirmed the 200,188 rows equal the API count and the bulk CSV. Provider Information (4pq5-n9py), Inspection Dates (svdt-c123) and State US Averages (xcdc-v8bm) were pulled the same way.
Inclusion: rankings, severity, correction status and trend use K-tags only (Life Safety Code). E-tags (emergency preparedness) are reported as a share of the file but not ranked. State rates use the 50 states and DC; Puerto Rico and Guam are in national totals only.
Derived metrics: tag shares divide tag citations by all K citations. Facility shares divide distinct facilities cited by the 14,690 facilities in Provider Information. State rates divide cycle 1 K citations by facilities in the state. Per-survey rates divide standard-survey K citations by fire safety standard surveys in Inspection Dates for the same year. System groups and plain-language names are our own mapping of CMS tag descriptions. All calculations are in derived_metrics.csv and the scripts folder.
Conflicts: where CMS's published state averages and our counts could differ, we recomputed CMS's measure (K plus E per facility) and found agreement for all 51 jurisdictions after rounding. Counts from AHCA and LeadingAge differ from ours because they use one fiscal year or one state; we report them side by side and do not combine them.
Limitations: the file covers each facility's last 3 inspection cycles, so it is not a calendar-year series; nursing homes that closed before September 2026 are not included; citation counts reflect surveyor practice as well as building conditions; and a single citation can describe several findings. Nothing here names or rates an individual facility.
Requirements are summarized from CMS and eCFR documents and cited by NFPA standard number; no NFPA text is reproduced. This report is not legal or compliance advice. Last updated 2026-10-26.
This report presents published data with its limitations. It is not legal, engineering, financial or investment advice. Requirements depend on the code edition your state and local fire marshal have adopted; confirm with your authority having jurisdiction.
Sources, ranked by quality
Tier 1: primary and official sources (21)
- [1] Centers for Medicare & Medicaid Services. Fire Safety Deficiencies (dataset ifjz-ge4w). Last 3 inspection cycles, survey dates 2016-07-28 to 2026-08-20; released 2026-10-08. Accessed 2026-10-26.
- [2] Centers for Medicare & Medicaid Services. Provider Information (dataset 4pq5-n9py). September 2026 file. Accessed 2026-10-26.
- [3] Centers for Medicare & Medicaid Services. Inspection Dates (dataset svdt-c123). Last 3 inspection cycles, September 2026 file. Accessed 2026-10-26.
- [4] Centers for Medicare & Medicaid Services. State US Averages (dataset xcdc-v8bm). September 2026 file. Accessed 2026-10-26.
- [5] Centers for Medicare & Medicaid Services. Nursing Home Data Dictionary. Updated September 2026. Accessed 2026-10-26.
- [6] Centers for Medicare & Medicaid Services. State Operations Manual, Chapter 7: Survey and Enforcement Process for SNFs and NFs. Rev. 244, issued 2026-06-26. Accessed 2026-10-26.
- [7] Centers for Medicare & Medicaid Services. State Operations Manual, Appendix I: Survey Procedures for Life Safety Code Surveys. Rev. 209, 2022-12-09. Accessed 2026-10-26.
- [8] Centers for Medicare & Medicaid Services. Form CMS-2786R, Fire Safety Survey Report, 2012 Life Safety Code, Healthcare. Form version 07/2018. Accessed 2026-10-26.
- [9] Centers for Medicare & Medicaid Services. Nursing Home Five-Star Quality Rating System: Technical Users' Guide. September 2026. Accessed 2026-10-26.
- [10] Office of the Federal Register (eCFR). 42 CFR 483.90, Physical environment. Current as of 2026-10-01. Accessed 2026-10-26.
- [11] Office of the Federal Register. Medicare and Medicaid Programs; Fire Safety Requirements for Certain Health Care Facilities (81 FR 26872). Published 2016-05-04, effective 2016-07-05. Accessed 2026-10-26.
- [12] National Fire Protection Association. NFPA 101, Life Safety Code (standard page). Standard page; CMS enforces the 2012 edition. Accessed 2026-10-26.
- [13] National Fire Protection Association. NFPA 99, Health Care Facilities Code (standard page). Standard page; CMS enforces the 2012 edition. Accessed 2026-10-26.
- [14] National Fire Protection Association. NFPA 25, Standard for the Inspection, Testing, and Maintenance of Water-Based Fire Protection Systems (standard page). Standard page. Accessed 2026-10-26.
- [15] National Fire Protection Association. NFPA 72, National Fire Alarm and Signaling Code (standard page). Standard page. Accessed 2026-10-26.
- [16] National Fire Protection Association. NFPA 10, Standard for Portable Fire Extinguishers (standard page). Standard page. Accessed 2026-10-26.
- [17] National Fire Protection Association. NFPA 96, Standard for Ventilation Control and Fire Protection of Commercial Cooking Operations (standard page). Standard page. Accessed 2026-10-26.
- [18] National Fire Protection Association. NFPA 110, Standard for Emergency and Standby Power Systems (standard page). Standard page. Accessed 2026-10-26.
- [19] National Fire Protection Association. NFPA 80, Standard for Fire Doors and Other Opening Protectives (standard page). Standard page. Accessed 2026-10-26.
- [20] HHS Office of Inspector General (via Oversight.gov). Audits of Nursing Home Life Safety and Emergency Preparedness in Eight States (A-02-21-01010). July 2022; site visits in 8 states. Accessed 2026-10-26.
- [21] U.S. Government Accountability Office. Nursing Home Fire Safety: Recent Fires Highlight Weaknesses in Federal Standards and Oversight (GAO-04-660). 2004-07-16. Accessed 2026-10-26.
Tier 2: trade bodies, market research, company data (3)
- [22] American Health Care Association. Life Safety Code Tips: top cited K-tags (QCOR FY 2023). Federal fiscal year 2023 (Oct 2022 to Sep 2023). Accessed 2026-10-26.
- [23] LeadingAge New York. Life Safety Code and Emergency Preparedness Deficiencies (New York top 20 tags). 2016-11-01 to 2018-07-11, New York only. Accessed 2026-10-26.
- [24] LeadingAge Minnesota. Top Cited Deficiencies from Nursing Home Recertification Surveys. Federal fiscal year 2021, Minnesota only. Accessed 2026-10-26.