Smoke Alarm Statistics: How Often Alarms Were Present, Worked and Failed in Residential Fires, 2020 to 2024
- Primary data
- FEMA/USFA NFIRS Public Data Release, fireincident, basicincident and civiliancasualty tables
- Data period
- 2020 to 2024 (2025 partial year shown separately)
- Latest release used
- 2026-05-01
- Next release
- None: the 2025 PDR is the last NFIRS release; reporting moved to NERIS in 2026
- Geography
- United States, fire departments reporting to NFIRS (not a national census)
- Sources
- 22 (17 Tier 1)
Smoke alarm statistics from 562,179 nonconfined residential building fires reported to NFIRS in 2020 to 2024: an alarm was present in 62.1% of fires with known status and operated in 88.9% of fires large enough to trigger it. Batteries caused 56.9% of known-reason failures. Deaths per 1,000 fires were 7.4 with an operating alarm, 10.9 with none.
How the index is built
Smoke alarm performance index
FormulaIndex = (present / (present + none present)) x (operated / (operated + failed)) x (alerted / (alerted + failed to alert)) x 100, occupied residential building fires
Inputs: fact sheet rows for presence, operation and alert rates by property type; tables/t1_performance_index.csv (fact sheet rows)
Result: All residential 60.0; one- and two-family 55.9; multifamily 73.1; other residential 59.5
Out of every 100 occupied residential fires with known data, about 60 had an alarm that was present, worked and warned the people inside. The property-type gap comes mainly from presence.
Limitations: Each rate drops its own unknowns, so the index assumes unknown fires behave like known ones. 'Alerted' counts occupants who failed to respond. Fires too small to trigger an alarm and fires with no occupants are excluded from the later stages.
Failure rate ratio by power source
Formulafailure rate (battery only) / failure rate (hardwired with battery backup)
Inputs: tables/t3_failure_by_power.csv (fact sheet rows)
Result: 2.3 (15.4% against 6.7%)
Battery-only alarms failed 2.3 times as often as hardwired alarms with battery backup in residential fires large enough to trigger them.
Limitations: Power source was unknown for 22.2% of alarms present; housing age and type differ between the groups.
Death rate gap by alarm status
Formula1 - (deaths per 1,000 fires, alarm operated / deaths per 1,000 fires, no alarm)
Inputs: tables/t4_outcomes_by_status.csv (fact sheet rows)
Result: 32.1% lower with an operating alarm; 36.2% lower when compared with no alarm or a failed alarm combined
Operating alarms are associated with fewer deaths per fire, in line with NFPA's direction but smaller than its approximately 60% estimate.
Limitations: Association, not causation. Raw counts with unknowns excluded; nearly half of deaths fall in fires with undetermined presence.
Trend in battery-related failures
Formulabattery-related share of known-reason failures, 2024 minus 2020
Inputs: tables/t6_trend.csv (fact sheet rows)
Result: -6.8 percentage points (59.9% to 53.1%)
Battery problems are a shrinking share of failures as the alarm mix shifts toward hardwired units with battery backup.
Limitations: Department reporting mix changes each year; 2025 excluded as partial.
10-year sealed battery law comparison
Formulabattery-related share (other states) - battery-related share (10-year states), with and without California
Inputs: tables/t8_ten_year_law_comparison.csv (fact sheet rows)
Result: 5.7 points with California; 1.4 points without
The apparent difference is mostly a California effect, so NFIRS does not show a measurable law effect.
Limitations: Laws cover new sales or installs only; NFIRS does not record sealed versus replaceable batteries; z = 4.3 ignores clustering.
Smoke alarm statistics by property type: present, operated, alerted
In occupied residential building fires reported to NFIRS from 2020 to 2024, the chain from 'alarm installed' to 'occupants warned' held in about 60 of every 100 fires with known status. Multifamily buildings scored highest and one- and two-family homes lowest, and almost all of the gap sits at the first link: whether an alarm was there at all.
The Fire Life and Safety smoke alarm performance index multiplies three NFIRS shares, each computed only on fires where the field was known: the share of fires with an alarm present, the share of those alarms that operated when the fire was large enough to trigger them, and the share of operating alarms that alerted occupants who were there. Across 474,066 occupied residential building fires in 2020 to 2024, the index was 60.0 out of 100.
| Property type | Fires (occupied buildings) | Presence unknown (%) | Present (% of known) | Operated (% of present, fire large enough, known) | Alerted occupants (% of operated, known, occupants present) | Performance index (0 to 100) | Index, all building statuses |
|---|---|---|---|---|---|---|---|
| One- and two-family homes (419) | 344,117 | 31.6 | 65.5 | 88.0 | 96.9 | 55.9 | 49.3 |
| Multifamily dwellings (429) | 89,577 | 17.2 | 82.2 | 90.3 | 98.4 | 73.1 | 70.8 |
| Other residential (400, 439 to 464) | 40,372 | 28.8 | 66.9 | 91.4 | 97.2 | 59.5 | 50.5 |
| All residential | 474,066 | 28.6 | 69.3 | 88.9 | 97.4 | 60.0 | 53.7 |
Nonconfined residential building fires in occupied buildings (STRUC_STAT 2). Each stage excludes unknowns from its own denominator; presence unknown is shown separately. Index = present share x operated share x alerted share. Raw NFIRS counts, not national estimates.
Source: [1][2][3][4][5] FEMA / U.S. Fire Administration; FEMA / U.S. Fire Administration; FEMA / U.S. Fire Administration; FEMA / U.S. Fire Administration; FEMA / U.S. Fire Administration
Share present (known), operated (fires large enough), alerted occupants, and the combined index, 2020 to 2024
Source: Fire Life and Safety analysis of USFA NFIRS Public Data Release 2020 to 2024
Multifamily dwellings (property use 429) scored 73.1, driven by an alarm presence share of 82.2% where presence was known. One- and two-family homes (419) scored 55.9, with presence at 65.5%. Once an alarm was present, operation (88.0% to 91.4%) and alerting (96.9% to 98.4%) varied far less by property type. The practical point for owners and managers of apartments and HOA buildings is that installation and code-required coverage do most of the work; the fire alarm inspection and testing page covers the inspection side for building systems.
Including vacant, idle and under-construction buildings lowers the index to 53.7 for all residential property, 49.3 for one- and two-family homes and 70.8 for multifamily. USFA's analysis guidelines recommend the occupied-building view for effectiveness and note that multifamily analyses can reasonably include all statuses, because neighbors may hear an alarm in an empty unit (USFA, NFIRS 5.0 Fire Data Analysis Guidelines).
Where each residential fire landed in the alarm sequence
Shown the way USFA presents it, with unknowns left in place, the largest single group in occupied residential fires is 'presence undetermined' (28.6%), followed by 'operated and alerted occupants who responded' (22.8%) and 'no alarm present' (21.9%).
| Smoke alarm status | 1-2 family fires | 1-2 family % | Multifamily fires | Multifamily % | Other residential fires | Other residential % | All residential fires | All residential % |
|---|---|---|---|---|---|---|---|---|
| No smoke alarm present | 81,204 | 23.6 | 13,176 | 14.7 | 9,516 | 23.6 | 103,896 | 21.9 |
| Presence undetermined or blank | 108,644 | 31.6 | 15,368 | 17.2 | 11,613 | 28.8 | 135,625 | 28.6 |
| Present: fire too small to activate | 25,111 | 7.3 | 8,533 | 9.5 | 2,355 | 5.8 | 35,999 | 7.6 |
| Present: operated, alerted occupants who responded | 66,920 | 19.4 | 31,046 | 34.7 | 10,104 | 25.0 | 108,070 | 22.8 |
| Present: operated, occupants failed to respond | 1,947 | 0.6 | 1,700 | 1.9 | 489 | 1.2 | 4,136 | 0.9 |
| Present: operated, no occupants | 11,789 | 3.4 | 3,855 | 4.3 | 1,077 | 2.7 | 16,721 | 3.5 |
| Present: operated, failed to alert occupants | 2,172 | 0.6 | 541 | 0.6 | 307 | 0.8 | 3,020 | 0.6 |
| Present: operated, effectiveness undetermined | 10,484 | 3.0 | 3,467 | 3.9 | 1,040 | 2.6 | 14,991 | 3.2 |
| Present: failed to operate | 12,724 | 3.7 | 4,342 | 4.8 | 1,219 | 3.0 | 18,285 | 3.9 |
| Present: operation undetermined | 23,122 | 6.7 | 7,549 | 8.4 | 2,652 | 6.6 | 33,323 | 7.0 |
| Total | 344,117 | 100.0 | 89,577 | 100.0 | 40,372 | 100.0 | 474,066 | 100.0 |
USFA-style presentation: unknowns kept as their own rows. Percentages are of all occupied-building fires in each column.
Source: [1][2][3][4][5] FEMA / U.S. Fire Administration; FEMA / U.S. Fire Administration; FEMA / U.S. Fire Administration; FEMA / U.S. Fire Administration; FEMA / U.S. Fire Administration
Alarms that were present but failed to operate account for 3.9% of occupied residential fires (18,285 fires), and alarms that sounded but failed to alert anyone account for 0.6% (3,020 fires). A further 3.5% of fires (16,721) had an operating alarm and nobody home. Occupants who were alerted but failed to respond appear in 0.9% of fires; NFPA's estimate is that 9% of deaths in homes with working alarms fall into that group (NFPA's June 2024 report).
Fire too small to activate: NFIRS code 1 in Detector Operation: an alarm was present but the fire did not produce enough smoke or heat to trigger it. These fires (7.6% of occupied residential fires) are excluded from the operation-rate denominator.
Why smoke detectors failed: batteries, power cuts and maintenance, by power source
Batteries explain most failures where the reason is known: 56.9% of known-reason failures across all power sources, and 73.1% for battery-only alarms. Hardwired alarms with battery backup failed least often (6.7% of fires large enough to trigger them), less than half the battery-only failure rate of 15.4%.
| Failure reason | Battery only (n) | Battery only (%) | Hardwired only (n) | Hardwired only (%) | Hardwired with battery backup (n) | Hardwired with battery backup (%) | All power sources incl. unknown (n) | All power sources incl. unknown (%) |
|---|---|---|---|---|---|---|---|---|
| Battery missing or disconnected | 2,868 | 39.8 | 0 | 0.0 | 481 | 24.6 | 3,597 | 33.1 |
| Battery discharged or dead | 2,401 | 33.3 | 0 | 0.0 | 85 | 4.4 | 2,585 | 23.8 |
| Hardwired power failure, shut-off or disconnect | 0 | 0.0 | 236 | 41.2 | 392 | 20.1 | 795 | 7.3 |
| Lack of maintenance or cleaning | 476 | 6.6 | 77 | 13.4 | 197 | 10.1 | 868 | 8.0 |
| Defective | 376 | 5.2 | 81 | 14.1 | 146 | 7.5 | 651 | 6.0 |
| Improper installation or placement | 251 | 3.5 | 21 | 3.7 | 94 | 4.8 | 438 | 4.0 |
| Other | 838 | 11.6 | 158 | 27.6 | 557 | 28.5 | 1,931 | 17.8 |
| Failures with a known reason | 7,210 | 100.0 | 573 | 100.0 | 1,952 | 100.0 | 10,865 | 100.0 |
| Failures, reason undetermined | 3,518 | 32.8 | 547 | 48.8 | 1,398 | 41.7 | 8,377 | 43.5 |
| Failure rate (% of fires large enough, operation known) | 10,728 | 15.4 | 1,120 | 8.7 | 3,350 | 6.7 | 19,242 | 11.1 |
| Battery-related share of known-reason failures (%) | 5,269 | 73.1 | 0 | 0.0 | 566 | 29.0 | 6,182 | 56.9 |
Nonconfined residential building fires with an alarm present that failed to operate (DET_OPERAT 3). Reason shares use known reasons only. Failure rate = failed / (operated + failed). 'Lack of maintenance or cleaning' is code 4 (codelookup: lack of cleaning; Complete Reference Guide: lack of maintenance, includes not cleaning).
Source: [1][2][3][4][5][9] FEMA / U.S. Fire Administration; FEMA / U.S. Fire Administration; FEMA / U.S. Fire Administration; FEMA / U.S. Fire Administration; FEMA / U.S. Fire Administration; U.S. Fire Administration
Share of failures with a known reason, residential building fires, 2020 to 2024
Source: Fire Life and Safety analysis of USFA NFIRS Public Data Release 2020 to 2024
Alarms that failed to operate as a share of fires large enough to trigger them, 2020 to 2024
Source: Fire Life and Safety analysis of USFA NFIRS Public Data Release 2020 to 2024
For battery-only alarms, the top failure reason was a missing or disconnected battery (39.8% of known reasons), ahead of a dead battery (33.3%). A missing or disconnected battery points to a battery taken out or unplugged rather than one that wore out, so the leading cause is something done to the alarm, not a hardware defect. Lack of maintenance or cleaning (6.6%) and defective units (5.2%) trail far behind.
Hardwired-only alarms failed mostly because power was cut, shut off or disconnected (41.2% of known reasons). Hardwired alarms with battery backup show a mix: 24.6% missing or disconnected backup batteries, 20.1% power failures and 10.1% maintenance. The coding is internally consistent: no hardwired-only alarm in the data was recorded as failing for a battery reason.
Battery-only alarms were 50.1% of alarms with a known power source in residential fires, and 56.6% in one- and two-family homes. In multifamily buildings, hardwired with battery backup (40.7%) outnumbered battery-only (35.9%). Product defects are a small share of failures in NFIRS, but specific models do get pulled from sale; see the smoke alarm recalls registry.
Smoke, combination and heat detectors in residential fires
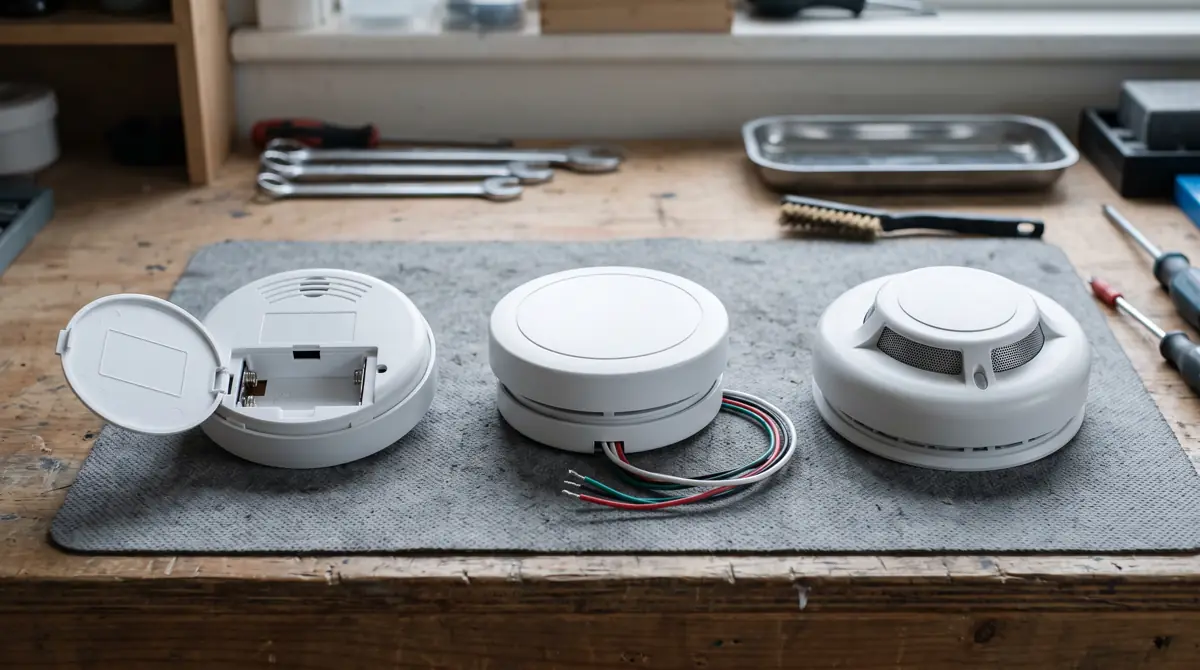
Where an alarm was present and its type was known, 88.9% were smoke alarms, 6.1% combination smoke-heat units and 0.4% heat detectors alone.
| Detector type | 1-2 family (n) | 1-2 family (% of known type) | Multifamily (n) | Multifamily (% of known type) | Other residential (n) | Other residential (% of known type) | All residential (n) | All residential (% of known type) |
|---|---|---|---|---|---|---|---|---|
| Smoke | 135,427 | 92.1 | 48,248 | 83.6 | 14,819 | 79.7 | 198,494 | 88.9 |
| Combination smoke-heat | 8,064 | 5.5 | 3,811 | 6.6 | 1,706 | 9.2 | 13,581 | 6.1 |
| More than one type | 1,995 | 1.4 | 2,971 | 5.2 | 1,138 | 6.1 | 6,104 | 2.7 |
| Heat | 417 | 0.3 | 347 | 0.6 | 149 | 0.8 | 913 | 0.4 |
| Sprinkler water flow detection | 223 | 0.2 | 1,816 | 3.1 | 485 | 2.6 | 2,524 | 1.1 |
| Other | 930 | 0.6 | 492 | 0.9 | 301 | 1.6 | 1,723 | 0.8 |
| Undetermined | 15,297 | 9.4 | 5,234 | 8.3 | 1,854 | 9.1 | 22,385 | 9.1 |
Shares use fires with a known detector type; the Undetermined row is a share of all fires with an alarm present.
Source: [1][2][3][4][5] FEMA / U.S. Fire Administration; FEMA / U.S. Fire Administration; FEMA / U.S. Fire Administration; FEMA / U.S. Fire Administration; FEMA / U.S. Fire Administration
Multifamily and other residential buildings show more variety: 3.1% of multifamily fires with an alarm recorded sprinkler water flow detection as the detector type, and 5.2% recorded more than one type, consistent with building-wide systems. NFIRS cannot separate photoelectric from ionization smoke alarms, and it does not record whether a combination unit includes carbon monoxide sensing; for CO requirements see carbon monoxide detector laws by state.
Deaths and injuries per 1,000 fires by smoke alarm status
Residential building fires where an alarm operated had 7.4 civilian deaths per 1,000 fires, against 10.9 with no alarm and 16.9 where an alarm was present but failed. That is an association in raw NFIRS counts, not proof that the alarm changed the outcome.
| Smoke alarm status | Fires | Civilian deaths | Civilian injuries | Deaths per 1,000 fires | Injuries per 1,000 fires | Deaths per 1,000: 1-2 family | Deaths per 1,000: multifamily | Deaths per 1,000: other residential |
|---|---|---|---|---|---|---|---|---|
| No alarm present | 150,111 | 1,642 | 5,238 | 10.9 | 34.9 | 11.8 | 8.8 | 6.7 |
| Alarm present and operated | 153,585 | 1,138 | 7,326 | 7.4 | 47.7 | 7.0 | 9.0 | 5.6 |
| Alarm present, failed to operate | 19,242 | 326 | 1,173 | 16.9 | 61.0 | 18.1 | 14.9 | 11.5 |
| Alarm present, fire too small | 37,024 | 19 | 437 | 0.5 | 11.8 | 0.5 | 0.7 | 0.4 |
| Alarm present, operation unknown | 35,873 | 559 | 1,556 | 15.6 | 43.4 | 14.9 | 20.5 | 7.8 |
| Presence undetermined or blank | 166,344 | 3,200 | 4,919 | 19.2 | 29.6 | 20.5 | 11.3 | 17.1 |
| Total | 562,179 | 6,884 | 20,649 | 12.2 | 36.7 | 13.1 | 9.8 | 9.5 |
All nonconfined residential building fires (every building status). Deaths and injuries are OTH_DEATH and OTH_INJ on the basic incident record; civilian casualty records coded death matched the totals in every year. Association, not causation.
Source: [1][2][3][4][5] FEMA / U.S. Fire Administration; FEMA / U.S. Fire Administration; FEMA / U.S. Fire Administration; FEMA / U.S. Fire Administration; FEMA / U.S. Fire Administration
Nonconfined residential building fires reported to NFIRS, 2020 to 2024
Source: Fire Life and Safety analysis of USFA NFIRS Public Data Release 2020 to 2024
The death rate with an operating alarm was 32.1% lower than with no alarm present, and fires with a failed alarm had 2.3 times the death rate of fires with an operating alarm. Combining 'no alarm' and 'failed alarm' gives 11.6 deaths per 1,000 fires, so an operating alarm is associated with a rate 36.2% lower. NFPA's national estimate for 2018 to 2022 puts the gap at approximately 60% (NFPA's June 2024 report); NFPA allocates unknowns and uses different home definitions, so the two figures are not directly comparable.
Of civilian deaths in fires where alarm presence was known, 44.6% occurred with no alarm present, 8.8% with an alarm that failed to operate and 30.9% with an alarm that operated. But 46.5% of all 6,884 deaths happened in fires where presence was undetermined or blank, so any death-share figure built on known records leaves out nearly half of the fatalities.
Two patterns warn against reading causation into the rates. In multifamily buildings, the death rate with an operating alarm (9.0 per 1,000) was about the same as with no alarm (8.8). And injuries per 1,000 fires were higher with an operating alarm (47.7) than with none (34.9), a pattern consistent with occupants being present and awake enough to act; NFIRS does not record why.
Cooking and other confined fires: did a detector alert anyone?
Confined fires (small cooking, chimney, trash and boiler fires) were almost as numerous as nonconfined building fires, 558,381 against 562,179, but NFIRS records only one alarm field for them. Where that field was known, a detector alerted occupants in 69.0% of confined residential fires.
| Property type | Confined building fires | Alarm alerted occupants (n) | Alerted (%) | Did not alert (n) | Did not alert (%) | Unknown or blank (n) | Unknown or blank (%) | Alerted (% of known) |
|---|---|---|---|---|---|---|---|---|
| One- and two-family homes (419) | 268,152 | 78,767 | 29.4 | 59,126 | 22.0 | 130,259 | 48.6 | 57.1 |
| Multifamily dwellings (429) | 222,466 | 110,993 | 49.9 | 32,791 | 14.7 | 78,682 | 35.4 | 77.2 |
| Other residential (400, 439 to 464) | 67,763 | 34,148 | 50.4 | 8,696 | 12.8 | 24,919 | 36.8 | 79.7 |
| All residential | 558,381 | 223,908 | 40.1 | 100,613 | 18.0 | 233,860 | 41.9 | 69.0 |
Confined fires (INC_TYPE 113 to 118) carry only the basic-module DET_ALERT field. 'Did not alert' can mean no alarm, no operation, occupants already aware, or nobody home.
Source: [1][2][3][4][5][8][9] FEMA / U.S. Fire Administration; FEMA / U.S. Fire Administration; FEMA / U.S. Fire Administration; FEMA / U.S. Fire Administration; FEMA / U.S. Fire Administration; U.S. Fire Administration; U.S. Fire Administration
The alert status was unknown or blank in 41.9% of confined residential fires, and 48.6% in one- and two-family homes. Multifamily confined fires had a detector alert in 77.2% of known cases, against 57.1% in one- and two-family homes. Following USFA guidance, these fires are reported separately and never mixed into the presence and operation figures above (USFA analysis guidelines). Confined residential fires recorded 2,327 civilian injuries and 2 deaths in 2020 to 2024.
Year by year: 2020 to 2024, with the partial 2025 file
Presence barely moved (between 61.6% and 62.6% of known each year), but the mix of alarms and failures shifted: hardwired alarms with battery backup gained share, battery-only alarms lost share, and battery problems fell from 59.9% to 53.1% of known-reason failures.
| Year | Nonconfined residential building fires | Presence unknown (%) | Alarm present (% of known) | Operated (% of present, fire large enough, known) | Alerted (% of operated, known) | Battery-related share of known-reason failures (%) | Battery-only share of alarms with known power (%) | Hardwired with battery backup share (%) | Civilian deaths | Deaths per 1,000 fires |
|---|---|---|---|---|---|---|---|---|---|---|
| 2020 | 104,308 | 29.2 | 62.3 | 87.9 | 96.8 | 59.9 | 52.0 | 33.8 | 1,347 | 12.9 |
| 2021 | 102,930 | 29.0 | 62.6 | 88.5 | 97.2 | 58.8 | 50.8 | 34.9 | 1,339 | 13.0 |
| 2022 | 116,165 | 29.6 | 61.6 | 88.7 | 97.6 | 57.9 | 50.2 | 35.1 | 1,422 | 12.2 |
| 2023 | 122,377 | 29.9 | 61.8 | 89.3 | 97.7 | 54.5 | 49.2 | 36.0 | 1,412 | 11.5 |
| 2024 | 116,399 | 30.1 | 62.2 | 89.8 | 97.5 | 53.1 | 48.7 | 36.4 | 1,364 | 11.7 |
| 2025 (partial, NERIS transition) | 98,399 | 29.6 | 62.6 | 90.2 | 97.6 | 52.0 | 47.8 | 37.2 | 1,053 | 10.7 |
2025 is a partial file: departments moved to NERIS during 2025 and December 2025 fire incidents are about half the December 2024 count. Trend statements in this report stop at 2024.
Source: [1][2][3][4][5][6][10] FEMA / U.S. Fire Administration; FEMA / U.S. Fire Administration; FEMA / U.S. Fire Administration; FEMA / U.S. Fire Administration; FEMA / U.S. Fire Administration; FEMA / U.S. Fire Administration; U.S. Fire Administration
Residential building fires reported to NFIRS, 2020 to 2024
Source: Fire Life and Safety analysis of USFA NFIRS Public Data Release 2020 to 2024
From 2020 to 2024 the battery-related share of known-reason failures fell 6.8 percentage points, the battery-only share of alarms with known power fell 3.3 points, the hardwired-with-backup share rose 2.6 points, and the operation rate rose 1.9 points, from 87.9% to 89.8%. Deaths per 1,000 nonconfined residential building fires moved from 12.9 in 2020 to 11.7 in 2024.
Do states with 10-year sealed battery rules show fewer battery failures?
At first glance, yes: battery problems were 68.4% of known battery-only failures in eight 10-year rule states versus 74.1% in 37 other jurisdictions. Remove California and the gap almost disappears (72.7%), and battery-only failure rates are the same (15.8% against 15.7%). NFIRS cannot show a law effect.
The comparison uses the statute coding in our smoke detector laws by state registry, which found 10 jurisdictions with a 10-year sealed battery rule, 8 of them with an effective year of 2019 or earlier: Oregon (1997), North Carolina (2013), California and Florida (2014), Massachusetts (2016), Maryland (2018), New Jersey and New York (2019). Every state reported residential fires to NFIRS in all five years (the District of Columbia in four), so participation does not rule the comparison out; how much each state's departments report does vary, which is why only within-state shares are compared.
| State group | Jurisdictions | Nonconfined residential building fires | Alarm present (% of known) | Battery-only share of alarms present (%) | Failure rate, all power sources (%) | Failure rate, battery-only alarms (%) | Battery-only failures with known reason | Battery-related share (%) | Battery missing or disconnected share (%) |
|---|---|---|---|---|---|---|---|---|---|
| 10-year sealed battery rule in force by 2019 | 8 | 129,669 | 65.3 | 32.2 | 9.5 | 14.4 | 1,423 | 68.4 | 35.7 |
| No statewide 10-year rule found | 37 | 379,057 | 61.2 | 41.1 | 11.8 | 15.7 | 5,125 | 74.1 | 40.9 |
| 10-year group without California | 7 | 86,977 | 67.6 | 28.8 | 9.9 | 15.8 | 967 | 72.7 | 39.0 |
| Both groups | 45 | 508,726 | 62.3 | 38.5 | 11.1 | 15.4 | 6,548 | 72.9 | 39.7 |
10-year group: OR, NC, CA, FL, MA, MD, NJ, NY (rule effective 2019 or earlier per the Fire Life and Safety statute coding). Excluded: IL and LA (effective year not established), HI, NH, OK, RI (not verified). Battery-only share uses all alarms present as the base. Shares only; no state ranking.
Source: [1][2][3][4][5][21] FEMA / U.S. Fire Administration; FEMA / U.S. Fire Administration; FEMA / U.S. Fire Administration; FEMA / U.S. Fire Administration; FEMA / U.S. Fire Administration; Fire Life and Safety
Residential building fires, 2020 to 2024
Source: Fire Life and Safety analysis of USFA NFIRS Public Data Release 2020 to 2024; state groups from the Fire Life and Safety smoke detector law registry
The 5.7-point gap in the battery-related share has a z statistic of 4.3 if every fire were independent, but fires cluster by department and state, and California alone supplies 456 of the group's 1,423 known-reason battery-only failures. Without California the gap is 1.4 points. Individual 10-year states range from 59.4% (California) to 78.7% (Florida).
- California's rule covers battery-only alarms approved for sale from July 1, 2014, which must have a nonreplaceable battery lasting at least 10 years (Cal. H&S Code 13114).
- Florida requires a 10-year nonremovable battery when a battery-powered alarm is newly installed or replaced after a level 1 alteration (Fla. Stat. 553.883).
- Maryland required upgraded alarm placement in all existing residential occupancies by January 1, 2018, and refers to sealed long-life battery alarms (Md. Public Safety 9-104).
- Oregon requires solely battery-operated ionization alarms sold in the state to be packaged with a 10-year battery (ORS 479.297).
Most of these rules apply to alarms sold or installed after a date, not to every alarm already on a ceiling, and NFIRS does not record whether a battery-only alarm had a sealed or a replaceable battery. A test that could show a law effect would need that field. Until then, the safest reading is that the state-level data neither confirms nor rules out a benefit.
How these NFIRS counts compare with NFPA's national estimates
NFPA's report is the standard reference and its headline figures point the same way as ours. The differences come from method: NFPA scales NFIRS to national estimates and allocates unknowns, covers 2018 to 2022, and reports homes as a single category.
NFPA estimates that smoke alarms were present in 74% of reported home fires in 2018 to 2022, that 59% of home fire deaths occurred with no alarm (43%) or an alarm that failed (16%), and that hardwired alarms operated in 94% of fires large enough to trigger them against 85% for battery-only alarms (NFPA's June 2024 report).
Our raw counts give an operation rate of 93.3% for hardwired alarms with battery backup, 91.3% for hardwired-only and 84.6% for battery-only, close to NFPA's estimates. Presence is lower in our data (62.1% of known, all building statuses) because unknowns are not redistributed and confined fires are kept separate. This report adds what the NFPA page does not publish: 2023 and 2024 data, a split by property type, confined fires, year-by-year shares, the undistributed unknowns, and a state law comparison.
Key findings
- Across 474,066 occupied residential building fires reported to NFIRS in 2020 to 2024, the smoke alarm performance index was 60.0 out of 100.[1][2][3][4][5]
- Multifamily dwellings scored 73.1 on the index and one- and two-family homes 55.9 (occupied buildings, 2020 to 2024, NFIRS).[1][2][3][4][5]
- An alarm was present in 82.2% of occupied multifamily fires with known status, against 65.5% in one- and two-family homes (NFIRS, 2020 to 2024).[1][2][3][4][5]
- Battery-only alarms failed in 15.4% of residential fires large enough to trigger them; hardwired-only alarms 8.7%; hardwired with battery backup 6.7% (NFIRS, 2020 to 2024).[1][2][3][4][5]
- Missing or disconnected batteries were 39.8% and dead batteries 33.3% of known-reason battery-only failures (NFIRS, 2020 to 2024).[1][2][3][4][5]
- Power failure, shut-off or disconnect caused 41.2% of known-reason hardwired-only failures (NFIRS, 2020 to 2024).[1][2][3][4][5]
- The failure reason was undetermined for 43.5% of failed alarms in residential building fires (NFIRS, 2020 to 2024).[1][2][3][4][5]
- Residential building fires with an operating alarm had 7.4 civilian deaths per 1,000 fires; fires with no alarm had 10.9 and fires with a failed alarm 16.9 (NFIRS, 2020 to 2024).[1][2][3][4][5]
- 46.5% of the 6,884 civilian deaths in nonconfined residential building fires occurred where alarm presence was undetermined or blank (NFIRS, 2020 to 2024).[1][2][3][4][5]
- Where alarm type was known, 88.9% of alarms in residential fires were smoke alarms, 6.1% combination smoke-heat and 0.4% heat-only (NFIRS, 2020 to 2024).[1][2][3][4][5]
- In confined residential fires with a known alert status, a detector alerted occupants 69.0% of the time (NFIRS, 2020 to 2024).[1][2][3][4][5]
- The battery-related share of known-reason failures fell from 59.9% in 2020 to 53.1% in 2024 (NFIRS).[1][2][3][4][5]
- In eight 10-year sealed battery states, 68.4% of known-reason battery-only failures were battery related, against 74.1% in 37 jurisdictions without such a rule; without California the figure is 72.7% (NFIRS 2020 to 2024).[1][2][3][4][5][21]
Summary for decision makers
- An alarm was present in 62.1% of 562,179 nonconfined residential building fires with known status reported to NFIRS in 2020 to 2024.
- When present and the fire was large enough, alarms operated 88.9% of the time; hardwired with battery backup 93.3%, battery-only 84.6%.
- Batteries explain 56.9% of failures with a known reason; for battery-only alarms the top reason was a missing or disconnected battery (39.8%).
- The smoke alarm performance index was 73.1 in multifamily buildings and 55.9 in one- and two-family homes, mostly because of presence.
- Deaths per 1,000 fires: 7.4 with an operating alarm, 10.9 with none, 16.9 with a failed alarm, and 19.2 where presence was undetermined.
- Battery problems fell from 59.9% to 53.1% of known-reason failures between 2020 and 2024 as hardwired alarms gained share.
- States with a 10-year sealed battery rule show no clear difference once California is set aside (72.7% against 74.1% battery-related).
Questions people ask
Why do smoke detectors fail?
In residential building fires reported to NFIRS in 2020 to 2024, 33.1% of failures with a known reason were missing or disconnected batteries, 23.8% dead batteries, 8.0% lack of maintenance or cleaning, 7.3% hardwired power failures, 6.0% defective units and 4.0% improper installation or placement. The reason was undetermined for 43.5% of failed alarms.
What is the smoke alarm failure rate?
When an alarm was present and the fire was large enough to trigger it, alarms failed in 11.1% of residential building fires reported to NFIRS in 2020 to 2024: 15.4% for battery-only alarms, 8.7% for hardwired-only and 6.7% for hardwired with battery backup.
Do hardwired smoke alarms fail less than battery ones?
Yes in NFIRS 2020 to 2024: hardwired alarms with battery backup operated 93.3% of the time and hardwired-only 91.3%, against 84.6% for battery-only alarms. NFPA's 2018 to 2022 estimates are 94% and 85%.
How many home fires have no smoke alarm?
In nonconfined residential building fires reported to NFIRS in 2020 to 2024, no alarm was present in 150,111 fires, or 37.9% of fires where presence was known. Presence was undetermined in another 166,344 fires.
Do working smoke alarms reduce fire deaths?
Fires with an operating alarm had 7.4 civilian deaths per 1,000 fires, against 10.9 with no alarm and 16.9 with a failed alarm (NFIRS, 2020 to 2024). That is an association; fire severity and occupant factors also differ between the groups.
For journalists and researchers
If you cite only a few, cite these
- Smoke alarm performance index 60.0 (occupied residential building fires, NFIRS 2020 to 2024): 73.1 multifamily, 55.9 one- and two-family.[1][2][3][4][5]
- Battery-only alarm failure rate 15.4% against 6.7% for hardwired with battery backup (NFIRS 2020 to 2024).[1][2][3][4][5]
- Deaths per 1,000 residential building fires: 7.4 with an operating alarm, 10.9 with none, 16.9 with a failed alarm (NFIRS 2020 to 2024).[1][2][3][4][5]
Most quotable statistics
- In residential building fires reported to NFIRS in 2020 to 2024, battery-only smoke alarms failed in 15.4% of fires large enough to trigger them, against 6.7% for hardwired alarms with battery backup.[1][2][3][4][5]
- Missing, disconnected or dead batteries caused 73.1% of known-reason battery-only smoke alarm failures in 2020 to 2024 (NFIRS).[1][2][3][4][5]
- Out of every 100 occupied residential fires with known data in 2020 to 2024, about 60 had a smoke alarm that was present, operated and alerted occupants (NFIRS).[1][2][3][4][5]
- Residential fires with a failed smoke alarm had 16.9 civilian deaths per 1,000 fires, 2.3 times the 7.4 in fires where an alarm operated (NFIRS, 2020 to 2024).[1][2][3][4][5]
- Nearly half (46.5%) of civilian deaths in residential building fires in 2020 to 2024 occurred where investigators could not determine whether a smoke alarm was present (NFIRS).[1][2][3][4][5]
- Battery problems fell from 59.9% to 53.1% of known-reason smoke alarm failures between 2020 and 2024 (NFIRS).[1][2][3][4][5]
Press summary
A Fire Life and Safety analysis of 562,179 nonconfined residential building fires reported to the federal NFIRS system in 2020 to 2024 finds that a smoke alarm was present in 62.1% of fires where presence was known and operated in 88.9% of fires large enough to trigger it. Battery-only alarms failed in 15.4% of those fires, more than twice the 6.7% rate for hardwired alarms with battery backup, and missing, disconnected or dead batteries explained 73.1% of battery-only failures with a known reason. A performance index combining presence, operation and alerting scored 60.0 out of 100 in occupied buildings: 73.1 for multifamily and 55.9 for one- and two-family homes. Fires with an operating alarm had 7.4 civilian deaths per 1,000 fires against 16.9 where an alarm failed, an association rather than proof of cause. Battery problems fell from 59.9% to 53.1% of known failures over the period. States with 10-year sealed battery rules showed no clear difference once California was excluded.
Suggested headlines
- Battery-only smoke alarms failed more than twice as often as hardwired units in 2020 to 2024 fires
- Missing and dead batteries behind 73.1% of known battery-only smoke alarm failures
- Only about 60 of 100 residential fires had an alarm that was present, worked and warned occupants
- Apartments outscore houses on smoke alarm protection, 73.1 to 55.9
- 10-year sealed battery laws leave no clear mark in federal fire data
How to cite this report
Fire Life and Safety. (2026). Smoke Alarm Statistics: How Often Alarms Were Present, Worked and Failed in Residential Fires, 2020 to 2024. Retrieved from https://firelifeandsafety.com/reports/smoke-alarm-failure-statistics/
Reuse license
Data and tables are licensed CC BY 4.0. Attribution: “Source: Fire Life and Safety, Smoke Alarm Statistics: How Often Alarms Were Present, Worked and Failed in Residential Fires, 2020 to 2024” with a link to this page.
Download the data
Every table in this report is available as a CSV under CC BY 4.0. The fact sheet lists each value with its source URL and access date.
- derived_metrics.csv (CSV)
- fact_sheet.csv (CSV)
- t1_performance_index.csv (CSV)
- t2_alarm_cascade.csv (CSV)
- t3_failure_by_power.csv (CSV)
- t4_outcomes_by_status.csv (CSV)
- t5_alarm_type_mix.csv (CSV)
- t6_trend.csv (CSV)
- t7_confined_fires.csv (CSV)
- t8_ten_year_law_comparison.csv (CSV)
Frequently asked questions
Where do these smoke alarm statistics come from?
From the FEMA/USFA National Fire Incident Reporting System Public Data Release for 2020 to 2025. We counted 562,179 nonconfined and 558,381 confined residential building fires reported in 2020 to 2024, using the detector fields coded by fire departments.
Are these national totals?
No. NFIRS is voluntary and not a census, so counts are fires reported to NFIRS. Shares and rates computed inside NFIRS are more meaningful than the raw totals.
How often was a smoke alarm present in residential fires?
In 62.1% of nonconfined residential building fires with known presence (2020 to 2024), and 69.3% in occupied buildings. Presence was unknown in 28.6% of occupied-building fires.
What share of alarms failed because of batteries?
56.9% of failures with a known reason across all power sources, and 73.1% for battery-only alarms (NFIRS, 2020 to 2024).
Why do hardwired smoke alarms fail?
For hardwired-only alarms, 41.2% of known-reason failures were power failures, shut-offs or disconnects, 14.1% defective units and 13.4% lack of maintenance or cleaning (NFIRS, 2020 to 2024).
Are apartments better protected than houses?
In occupied buildings an alarm was present in 82.2% of multifamily fires with known status, against 65.5% in one- and two-family homes, and the performance index was 73.1 against 55.9 (NFIRS, 2020 to 2024).
How often does an alarm sound but fail to wake or warn people?
Alarms that operated but failed to alert occupants appear in 0.6% of occupied residential building fires, 3,020 fires in 2020 to 2024. Among operating alarms with known outcomes and occupants present, 97.4% alerted occupants.
What about kitchen fires that stay on the stove?
These confined fires carry a single alarm field. A detector alerted occupants in 40.1% of confined residential fires, did not in 18.0%, and the status was unknown in 41.9% (NFIRS, 2020 to 2024).
How often should smoke alarms be replaced?
USFA advises replacing smoke alarms 10 years from the manufacture date, testing 9-volt battery alarms monthly and replacing their batteries at least once every year. Check local rules, which vary by state; see our smoke detector laws registry.
Will there be newer NFIRS data?
No. The 2025 release (2026-05-01) is the last NFIRS release, and the 2025 file is partial. Reporting moved to NERIS in 2026, so future updates of this report will need NERIS data.
Methodology
Data: FEMA/USFA NFIRS Public Data Release (PDR) Fire and Hazardous Materials files for 2020 to 2025, loaded into a read-only DuckDB. We joined basicincident to fireincident on INCIDENT_KEY and year, and used civiliancasualty only to cross-check deaths. Every code value (DETECTOR, DET_TYPE, DET_POWER, DET_OPERAT, DET_EFFECT, DET_FAIL, DET_ALERT, AID, PROP_USE, STRUC_TYPE, STRUC_STAT, SEV) was confirmed against the PDR codelookup table and the NFIRS 5.0 Complete Reference Guide. Query and table scripts are in the downloadable files.
Universe: residential property use 400 to 499, grouped as one- and two-family (419), multifamily (429) and other residential (400, 439 to 464, including boarding houses, hotels, board and care and dormitories). Mutual or automatic aid given (AID 3 or 4) was excluded to avoid double counting, and incident keys listed as duplicates in the errata addenda were dropped. Following the USFA NFIRS 5.0 Fire Data Analysis Guidelines, nonconfined building fires are INC_TYPE 111 and 120 to 123 with STRUC_TYPE 1 or 2 (incident type 112 excluded), and confined fires are INC_TYPE 113 to 118 with STRUC_TYPE 1, 2 or blank. Confined fires carry only DET_ALERT and are reported separately.
Unknowns: USFA does not distribute unknowns, and neither do we. Every table shows unknown or blank shares. Rates that drop unknowns say so in the column name: presence uses present plus none present; operation uses operated plus failed (fires too small to trigger an alarm excluded); alerting uses alerted (including occupants who failed to respond) plus failed to alert (no occupants excluded). The performance index and the effectiveness stages use occupied buildings (STRUC_STAT 2) per USFA guidance; the all-status index is shown for comparison.
Casualties: civilian deaths and injuries are OTH_DEATH and OTH_INJ on the basic incident record. Civilian casualty records coded as deaths (SEV 5) matched the OTH_DEATH totals in every year from 2020 to 2025. Rates per 1,000 fires describe association only; alarm status is recorded at the fire level, not for each casualty.
2025: the 2025 PDR is partial because departments moved to NERIS during 2025 (21,366 departments against 22,582 in 2024, with fire incidents in the last quarter well below 2024). It is shown in the trend table but excluded from pooled figures and trend statements.
Law comparison: state groups come from the Fire Life and Safety statute registry. The eight 10-year states had rules in force for the whole 2020 to 2024 period. Illinois and Louisiana were excluded because the effective year was not established, and four states not verified in the registry were also excluded. Only within-group shares are compared; states are not ranked. This is not legal advice; check the statute as adopted by your state.
Conflicting numbers: NFPA's national estimates differ from these raw counts because NFPA scales to national totals, allocates unknowns and covers 2018 to 2022. We cite NFPA headline figures only, with a link, and do not reproduce its tables. Last updated 2026-11-01.
This report presents published data with its limitations. It is not legal, engineering, financial or investment advice. Requirements depend on the code edition your state and local fire marshal have adopted; confirm with your authority having jurisdiction.
Sources, ranked by quality
Tier 1: primary and official sources (17)
- [1] FEMA / U.S. Fire Administration. NFIRS Public Data Release 2020, Fire and Hazardous Materials files. 2020. Accessed 2026-11-01.
- [2] FEMA / U.S. Fire Administration. NFIRS Public Data Release 2021, Fire and Hazardous Materials files. 2021. Accessed 2026-11-01.
- [3] FEMA / U.S. Fire Administration. NFIRS Public Data Release 2022, Fire and Hazardous Materials files. 2022. Accessed 2026-11-01.
- [4] FEMA / U.S. Fire Administration. NFIRS Public Data Release 2023, Fire and Hazardous Materials files. 2023. Accessed 2026-11-01.
- [5] FEMA / U.S. Fire Administration. NFIRS Public Data Release 2024, Fire and Hazardous Materials files. 2024. Accessed 2026-11-01.
- [6] FEMA / U.S. Fire Administration. NFIRS Public Data Release 2025, Fire and Hazardous Materials files. 2025 (partial: NERIS transition). Accessed 2026-11-01.
- [7] FEMA. FEMA/USFA NFIRS Annual Data (OpenFEMA dataset page). 1980 to 2025. Accessed 2026-11-01.
- [8] U.S. Fire Administration. NFIRS 5.0 Fire Data Analysis Guidelines and Issues. NFIRS 5.0. Accessed 2026-11-01.
- [9] U.S. Fire Administration. NFIRS 5.0 Complete Reference Guide (2015). NFIRS 5.0 coding. Accessed 2026-11-01.
- [10] U.S. Fire Administration. About NFIRS and Release Notes 2025 (released 2026-05-01, in the 2025 PDR zip). 2025. Accessed 2026-11-01.
- [11] U.S. Fire Administration. Data Quality Errata Addendum, 2025 NFIRS PDR (05-01-2026). 2025. Accessed 2026-11-01.
- [12] U.S. Fire Administration. 2024 NFIRS Data Quality Notes (05-01-2025) and PDR 2024 errata addendum. 2024. Accessed 2026-11-01.
- [13] U.S. Fire Administration. NFIRS Public Data Release Format v1.8. PDR file layout. Accessed 2026-11-01.
- [14] U.S. Fire Administration. National Fire Incident Reporting System (NFIRS) program page. 2026. Accessed 2026-11-01.
- [15] U.S. Fire Administration. Smoke alarms (prevention guidance). 2026. Accessed 2026-11-01.
- [16] Florida Legislature. Florida Statutes 553.883, Smoke alarms in one-family and two-family dwellings and townhomes. Law in force 2026. Accessed 2026-11-01.
- [17] Maryland General Assembly. Maryland Code, Public Safety 9-104. Law in force 2026. Accessed 2026-11-01.
Tier 2: trade bodies, market research, company data (5)
- [18] National Fire Protection Association. Smoke Alarms in US Home Fires (Tucker McGree, June 2024). 2018 to 2022 (national estimates). Accessed 2026-11-01.
- [19] Public.Law. California Health and Safety Code 13114 (Public.Law mirror). Law in force 2026. Accessed 2026-11-01.
- [20] Public.Law. Oregon Revised Statutes 479.297 (Public.Law mirror). Law in force 2026. Accessed 2026-11-01.
- [21] Fire Life and Safety. Smoke detector laws by state (coded statute registry). Law as opened 2026-10-27. Accessed 2026-11-01.
- [22] UL FSRI for the U.S. Fire Administration. National Emergency Response Information System (NERIS). 2026. Accessed 2026-11-01.