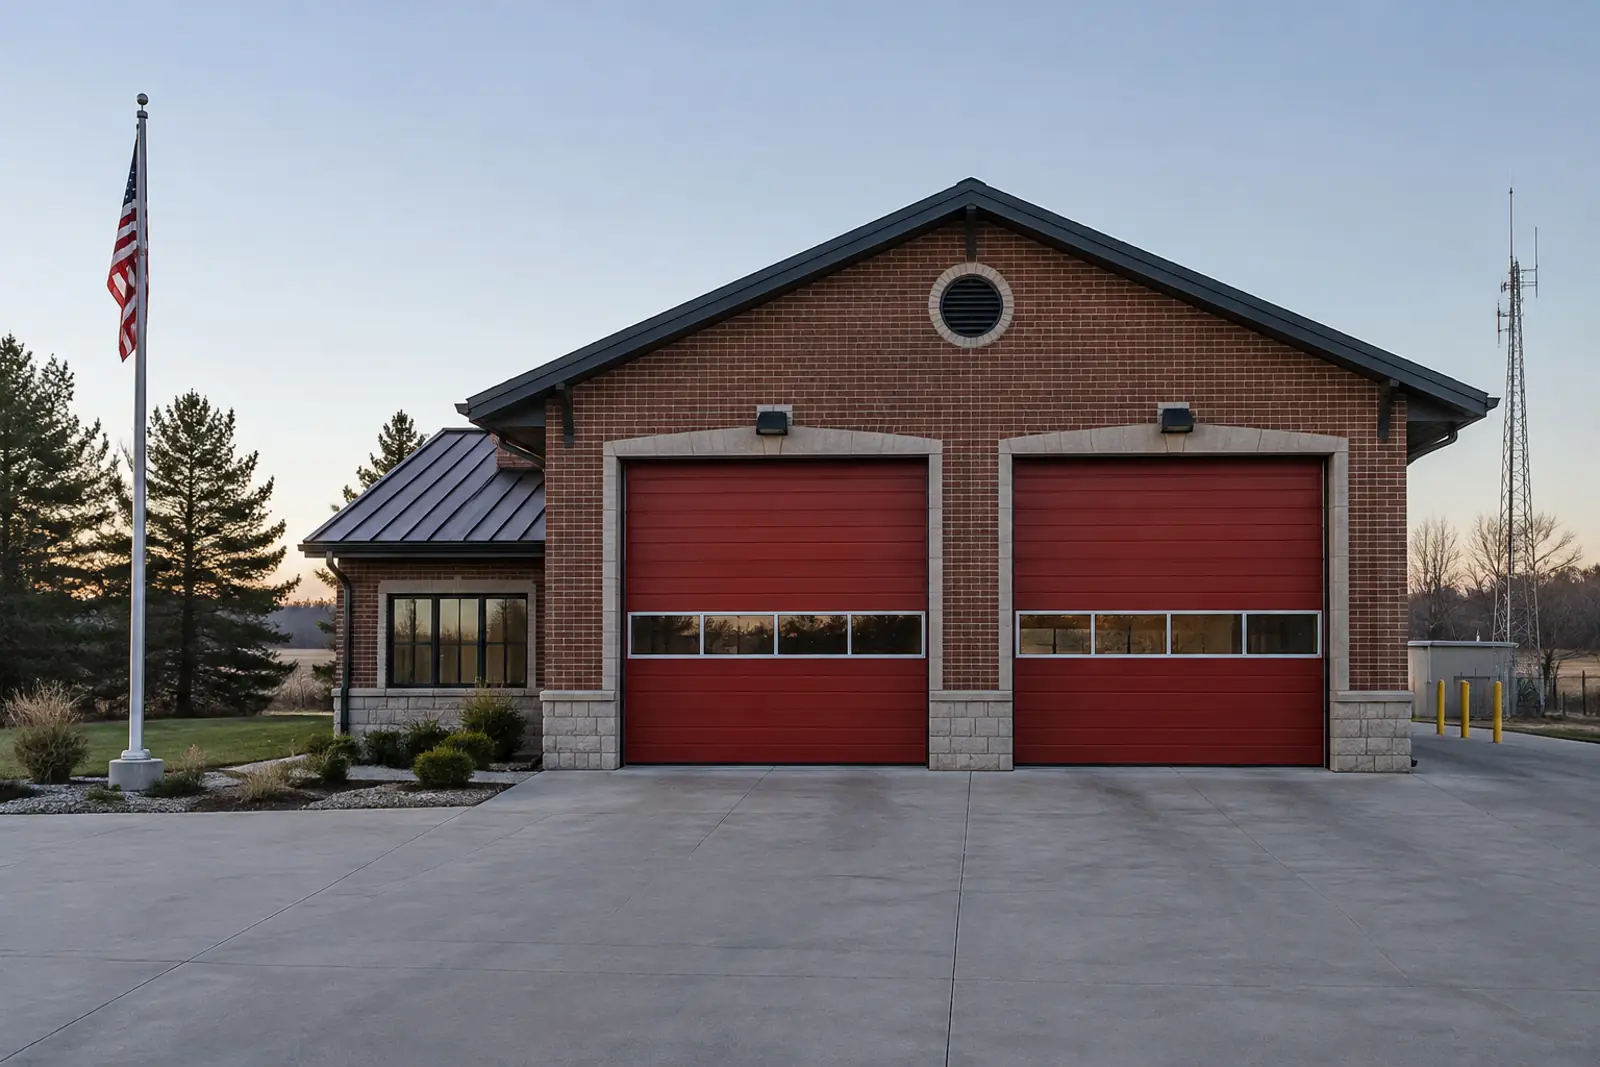
Volunteer Fire Departments by State: Career vs Volunteer Counts From the Final 2026 Registry File
- Primary data
- USFA National Fire Department Registry, national download file (27,117 departments), counted by Fire Life and Safety; cross-checked against the NERIS department listing (30,699 entities, October 27, 2026)
- Data period
- Registry records added or changed before June 2026 (registry last updated June 11, 2026); population July 1, 2025; BLS May 2025
- Latest release used
- 2026-06-11
- Next release
- None: the registry stopped accepting registrations and updates in June 2026; its successor listing is NERIS
- Geography
- 50 states and the District of Columbia (territory rows counted in national totals only)
- Sources
- 16 (13 Tier 1)
Counting all 27,117 rows of the USFA registry (last updated June 11, 2026) gives volunteer fire departments by state ranging from 92.3% of Nebraska's departments to 8.3% of Hawaii's. Nationally, 18,952 departments (69.9%) are all-volunteer, 4,166 mostly volunteer, 1,393 mostly career and 2,606 all-career, with 15.3 stations per 100,000 residents.
How the index is built
Volunteer reliance index (VRI)
Formulavolunteer firefighters / (career + volunteer + paid-per-call firefighters) x 100, per state
Inputs: fact sheet rows 20 to 23; table t2 (fact sheet rows)
Result: 52.6% nationally (all rows); 90.2% in South Dakota to 6.2% in Hawaii; above 50% in 28 of 51 jurisdictions
Measures how much of a state's registered firefighting workforce is unpaid volunteers, which department-type shares overstate.
Limitations: Self-reported rosters can include members who rarely respond; paid-per-call members are kept out of the volunteer count; GA, MD, NV and VA may double count county affiliates.
Stations per 100,000 residents
Formulasum of Number Of Stations by state / Census population July 1, 2025 x 100,000
Inputs: fact sheet rows 18 and 52; table t3 (fact sheet rows)
Result: 15.3 for the 50 states and DC; 48.0 in North Dakota to 7.5 in Florida among the states
Shows how much fixed station infrastructure registered departments report relative to population.
Limitations: Unregistered departments are missing; station counts are self-reported and not deduplicated in four states.
Firefighters per 1,000 residents
Formula(career + volunteer + paid-per-call) / population x 1,000
Inputs: fact sheet rows 23 and 52; table t2 (fact sheet rows)
Result: 3.12 for the 50 states and DC; 11.08 in North Dakota to 1.49 in Florida
A headcount ratio that rises where many small volunteer departments serve sparse populations.
Limitations: Rosters are not on-duty staffing; not a service standard.
Residents per career firefighter
Formulapopulation / registered career firefighters
Inputs: fact sheet rows 20 and 52; table t2 (fact sheet rows)
Result: 924 for the 50 states and DC; 463 in DC to 2,467 in Minnesota
Shows where paid full-time staff are concentrated relative to population.
Limitations: Career firefighters work rotating shifts; the ratio is not per-shift coverage.
Departments vs people by type
Formulaeach type's share of departments, stations and firefighters
Inputs: fact sheet rows 9 to 18 and 23; table t6 (fact sheet rows)
Result: All-volunteer: 69.9% of departments, 47.6% of stations, 48.4% of firefighters. All-career: 9.6% of departments, 23.9% of stations, 71.0% of career firefighters
The fire service is mostly volunteer by organization count and close to evenly split by workforce.
Limitations: Volunteer department totals include paid-per-call members.
Registry career count vs BLS paid jobs
Formularegistry career firefighters / (BLS OEWS 33-2011 + 33-1021), 48 jurisdictions
Inputs: fact sheet rows 20, 53, 54; table t5 (fact sheet rows)
Result: 0.83 (366,718 / 441,230); lowest Minnesota 0.34
An outside check on registry coverage of paid staff; low ratios line up with large paid-per-call rosters.
Limitations: Different reference dates (June 2026 file vs May 2025); BLS includes private and federal firefighters and part-time jobs.
Registry coverage
Formula27,117 registered / 29,452 NFPA-estimated departments x 100
Inputs: fact sheet rows 1 and 44 (fact sheet rows)
Result: 92.1%, close to USFA's own 91% estimate
About one department in eleven or twelve is not in the registry.
Limitations: NFPA's estimate is for 2020; coverage by state is unknown.
Registry vs NERIS listing
FormulaNERIS entities / registry departments, and NERIS volunteer / (volunteer + combination + career), 50 states + DC
Inputs: fact sheet rows 65 to 71; table t4 (fact sheet rows)
Result: 30,671 / 27,102 = 1.13; NERIS volunteer share 69.8% vs registry 69.9%
The successor listing is larger but describes the same volunteer-heavy mix, which supports the registry-based state shares.
Limitations: NERIS is live and still onboarding departments; 5,173 entities have no type; three-way vs four-way typing.
Volunteer fire departments by state: the final registry count
All-volunteer departments are the majority of registered departments in 38 of 51 jurisdictions. The 13 exceptions are the three Pacific Coast states, Arizona, Colorado, Florida, Georgia, Louisiana, Hawaii, Massachusetts, Rhode Island, Delaware and the District of Columbia.
We downloaded the registry's national file from the USFA download page on 2026-10-27 and counted all 27,117 rows by headquarters state and by the registry's own department type field. The total matches the 27,117 departments on USFA's Quick Facts page. Registration is voluntary, so every count below is a floor for the true number of departments.
Department type: USFA uses NFPA definitions: an all-career department has 100% career firefighters, a mostly career department 51% to 99%, a mostly volunteer department 1% to 50%, and an all-volunteer department none. Mostly volunteer and mostly career departments are often called combination departments.
Percent of each state's registered departments typed Volunteer (100% volunteer firefighters)
Source: U.S. Fire Administration, National Fire Department Registry download (last updated June 11, 2026); Fire Life and Safety count of all rows
Show all 53 rows
| State | Registered departments | All-volunteer | Mostly volunteer | Mostly career | All-career | All-volunteer share (%) | Departments per 100,000 residents |
|---|---|---|---|---|---|---|---|
| Alabama | 821 | 650 | 73 | 33 | 65 | 79.2 | 15.8 |
| Alaska | 155 | 88 | 49 | 2 | 16 | 56.8 | 21.0 |
| Arizona | 238 | 75 | 53 | 36 | 74 | 31.5 | 3.1 |
| Arkansas | 696 | 586 | 62 | 18 | 30 | 84.2 | 22.3 |
| California | 853 | 243 | 222 | 135 | 253 | 28.5 | 2.2 |
| Colorado | 310 | 139 | 89 | 35 | 47 | 44.8 | 5.2 |
| Connecticut | 246 | 152 | 53 | 11 | 30 | 61.8 | 6.7 |
| Delaware | 59 | 25 | 33 | 0 | 1 | 42.4 | 5.6 |
| District of Columbia | 3 | 0 | 0 | 1 | 2 | 0.0 | 0.4 |
| Florida | 389 | 115 | 32 | 65 | 177 | 29.6 | 1.7 |
| Georgia | 461 | 225 | 103 | 48 | 85 | 48.8 | 4.1 |
| Hawaii | 12 | 1 | 0 | 2 | 9 | 8.3 | 0.8 |
| Idaho | 198 | 113 | 61 | 8 | 16 | 57.1 | 9.8 |
| Illinois | 1,107 | 724 | 155 | 68 | 160 | 65.4 | 8.7 |
| Indiana | 766 | 556 | 109 | 28 | 73 | 72.6 | 11.0 |
| Iowa | 739 | 661 | 47 | 7 | 24 | 89.4 | 22.8 |
| Kansas | 499 | 392 | 56 | 20 | 31 | 78.6 | 16.8 |
| Kentucky | 688 | 521 | 100 | 27 | 40 | 75.7 | 14.9 |
| Louisiana | 427 | 202 | 157 | 24 | 44 | 47.3 | 9.2 |
| Maine | 341 | 238 | 80 | 11 | 12 | 69.8 | 24.1 |
| Maryland | 263 | 160 | 73 | 13 | 17 | 60.8 | 4.2 |
| Massachusetts | 363 | 87 | 102 | 57 | 117 | 24.0 | 5.1 |
| Michigan | 976 | 608 | 227 | 48 | 93 | 62.3 | 9.6 |
| Minnesota | 725 | 621 | 77 | 7 | 20 | 85.7 | 12.4 |
| Mississippi | 419 | 300 | 61 | 15 | 43 | 71.6 | 14.2 |
| Missouri | 755 | 536 | 94 | 36 | 89 | 71.0 | 12.0 |
| Montana | 285 | 233 | 33 | 5 | 14 | 81.8 | 24.9 |
| Nebraska | 389 | 359 | 15 | 2 | 13 | 92.3 | 19.3 |
| Nevada | 88 | 48 | 19 | 9 | 12 | 54.5 | 2.7 |
| New Hampshire | 211 | 112 | 63 | 22 | 14 | 53.1 | 14.9 |
| New Jersey | 713 | 536 | 84 | 34 | 59 | 75.2 | 7.5 |
| New Mexico | 249 | 193 | 24 | 7 | 25 | 77.5 | 11.7 |
| New York | 1,649 | 1,497 | 54 | 29 | 69 | 90.8 | 8.2 |
| North Carolina | 1,089 | 665 | 291 | 78 | 55 | 61.1 | 9.7 |
| North Dakota | 327 | 301 | 14 | 2 | 10 | 92.0 | 40.9 |
| Ohio | 1,148 | 677 | 234 | 79 | 158 | 59.0 | 9.6 |
| Oklahoma | 749 | 610 | 74 | 20 | 45 | 81.4 | 18.2 |
| Oregon | 289 | 119 | 127 | 22 | 21 | 41.2 | 6.8 |
| Pennsylvania | 1,771 | 1,589 | 120 | 19 | 43 | 89.7 | 13.6 |
| Rhode Island | 68 | 25 | 17 | 2 | 24 | 36.8 | 6.1 |
| South Carolina | 442 | 232 | 103 | 63 | 44 | 52.5 | 7.9 |
| South Dakota | 294 | 270 | 14 | 1 | 9 | 91.8 | 31.4 |
| Tennessee | 638 | 470 | 84 | 30 | 54 | 73.7 | 8.7 |
| Texas | 1,530 | 1,071 | 179 | 103 | 177 | 70.0 | 4.8 |
| Utah | 190 | 123 | 40 | 10 | 17 | 64.7 | 5.4 |
| Vermont | 206 | 180 | 16 | 7 | 3 | 87.4 | 32.0 |
| Virginia | 558 | 392 | 94 | 31 | 41 | 70.3 | 6.3 |
| Washington | 405 | 160 | 155 | 42 | 48 | 39.5 | 5.1 |
| West Virginia | 428 | 388 | 19 | 6 | 15 | 90.7 | 24.2 |
| Wisconsin | 762 | 601 | 104 | 12 | 45 | 78.9 | 12.8 |
| Wyoming | 115 | 81 | 21 | 1 | 12 | 70.4 | 19.5 |
| 50 states + DC | 27,102 | 18,950 | 4,166 | 1,391 | 2,595 | 69.9 | 7.9 |
| All rows incl. territories | 27,117 | 18,952 | 4,166 | 1,393 | 2,606 | 69.9 | n/a |
Department type is the registry's own field, based on NFPA definitions (all-career 100% career firefighters; mostly career 51% to 99%; mostly volunteer 1% to 50%; all-volunteer 0% career). Counts include every row, including 82 departments that reported zero firefighters. Departments per 100,000 uses Census July 1, 2025 population.
Source: [1][2][6] U.S. Fire Administration (FEMA); U.S. Fire Administration (FEMA); U.S. Census Bureau
The largest registered counts are in Pennsylvania (1,771), New York (1,649), Texas (1,530), Ohio (1,148), Illinois (1,107) and North Carolina (1,089). In Pennsylvania 1,589 departments and in New York 1,497 departments are all-volunteer (June 2026 file).
Delaware is a reminder that the all-volunteer share is not the whole picture. Only 42.4% of Delaware's 59 registered departments are all-volunteer, but another 33 are mostly volunteer, and volunteers make up 85.5% of the state's registered firefighters (see the volunteer reliance index).
Career vs volunteer firefighters: a volunteer reliance index for every state
Counting firefighters instead of departments lowers the volunteer share from 69.9% to 52.6%. Volunteers are a majority of registered firefighters in 28 of 51 jurisdictions.
Volunteer reliance index: Volunteer firefighters divided by all active firefighters (career, volunteer and paid-per-call) reported by a state's registered departments. It is our derived measure; the registry publishes the inputs but not the ratio by state.
Volunteer firefighters divided by career, volunteer and paid-per-call firefighters, by state
Source: Fire Life and Safety calculation from the USFA National Fire Department Registry download (last updated June 11, 2026)
Show all 52 rows
| State | Career firefighters | Volunteer firefighters | Paid-per-call firefighters | Volunteer reliance index (%) | Firefighters per 1,000 residents | Residents per career firefighter |
|---|---|---|---|---|---|---|
| Alabama | 6,725 | 13,661 | 918 | 64.1 | 4.10 | 772 |
| Alaska | 1,382 | 2,536 | 839 | 53.3 | 6.45 | 533 |
| Arizona | 8,778 | 1,445 | 1,185 | 12.7 | 1.50 | 869 |
| Arkansas | 3,134 | 9,941 | 2,148 | 65.3 | 4.89 | 994 |
| California | 44,463 | 9,136 | 5,445 | 15.5 | 1.50 | 885 |
| Colorado | 6,981 | 5,893 | 582 | 43.8 | 2.24 | 861 |
| Connecticut | 4,351 | 9,316 | 1,560 | 61.2 | 4.13 | 848 |
| Delaware | 455 | 3,450 | 131 | 85.5 | 3.81 | 2,330 |
| District of Columbia | 1,497 | 0 | 14 | 0.0 | 2.18 | 463 |
| Florida | 30,614 | 3,184 | 1,110 | 9.1 | 1.49 | 766 |
| Georgia | 14,469 | 8,286 | 1,829 | 33.7 | 2.18 | 781 |
| Hawaii | 2,421 | 161 | 0 | 6.2 | 1.80 | 592 |
| Idaho | 2,251 | 2,476 | 1,545 | 39.5 | 3.09 | 902 |
| Illinois | 15,862 | 13,406 | 10,599 | 33.6 | 3.13 | 802 |
| Indiana | 8,749 | 13,782 | 3,715 | 52.5 | 3.76 | 797 |
| Iowa | 2,103 | 13,846 | 2,370 | 75.6 | 5.66 | 1,540 |
| Kansas | 3,679 | 6,744 | 4,552 | 45.0 | 5.03 | 809 |
| Kentucky | 4,860 | 14,148 | 2,061 | 67.2 | 4.57 | 948 |
| Louisiana | 6,707 | 8,957 | 1,254 | 52.9 | 3.66 | 689 |
| Maine | 1,444 | 2,732 | 5,059 | 29.6 | 6.53 | 980 |
| Maryland | 9,112 | 21,061 | 238 | 69.3 | 4.85 | 688 |
| Massachusetts | 12,850 | 1,317 | 4,586 | 7.0 | 2.62 | 557 |
| Michigan | 7,343 | 3,920 | 14,916 | 15.0 | 2.58 | 1,379 |
| Minnesota | 2,363 | 8,237 | 9,086 | 41.8 | 3.38 | 2,467 |
| Mississippi | 3,602 | 7,447 | 881 | 62.4 | 4.04 | 820 |
| Missouri | 7,494 | 11,163 | 3,160 | 51.2 | 3.48 | 837 |
| Montana | 825 | 5,449 | 387 | 81.8 | 5.82 | 1,388 |
| Nebraska | 1,550 | 10,091 | 155 | 85.5 | 5.85 | 1,302 |
| Nevada | 3,109 | 2,043 | 1,143 | 32.5 | 1.92 | 1,056 |
| New Hampshire | 1,794 | 1,024 | 3,636 | 15.9 | 4.56 | 789 |
| New Jersey | 7,357 | 27,123 | 752 | 77.0 | 3.69 | 1,298 |
| New Mexico | 2,628 | 4,347 | 161 | 60.9 | 3.36 | 809 |
| New York | 17,593 | 80,346 | 392 | 81.7 | 4.92 | 1,137 |
| North Carolina | 12,204 | 26,027 | 5,593 | 59.4 | 3.91 | 918 |
| North Dakota | 706 | 7,635 | 513 | 86.2 | 11.08 | 1,132 |
| Ohio | 15,682 | 12,615 | 12,698 | 30.8 | 3.44 | 759 |
| Oklahoma | 4,824 | 10,306 | 1,130 | 63.4 | 3.94 | 855 |
| Oregon | 4,187 | 4,906 | 960 | 48.8 | 2.35 | 1,021 |
| Pennsylvania | 5,810 | 56,591 | 1,156 | 89.0 | 4.87 | 2,248 |
| Rhode Island | 2,263 | 1,368 | 356 | 34.3 | 3.58 | 492 |
| South Carolina | 7,295 | 10,616 | 1,273 | 55.3 | 3.44 | 764 |
| South Dakota | 601 | 7,149 | 180 | 90.2 | 8.48 | 1,556 |
| Tennessee | 7,967 | 12,554 | 2,378 | 54.8 | 3.13 | 918 |
| Texas | 29,482 | 26,626 | 2,044 | 45.8 | 1.83 | 1,076 |
| Utah | 2,584 | 2,417 | 1,681 | 36.2 | 1.89 | 1,370 |
| Vermont | 371 | 3,372 | 1,439 | 65.1 | 8.04 | 1,738 |
| Virginia | 11,747 | 21,987 | 823 | 63.6 | 3.89 | 756 |
| Washington | 9,195 | 7,769 | 3,339 | 38.3 | 2.54 | 870 |
| West Virginia | 1,089 | 9,590 | 170 | 88.4 | 6.14 | 1,622 |
| Wisconsin | 4,825 | 10,976 | 10,875 | 41.1 | 4.47 | 1,238 |
| Wyoming | 588 | 2,634 | 777 | 65.9 | 6.79 | 1,001 |
| 50 states + DC | 369,965 | 561,806 | 133,794 | 52.7 | 3.12 | 924 |
Self-reported active firefighters summed across registered departments. Volunteer reliance index = volunteer / (career + volunteer + paid-per-call). Georgia, Maryland, Nevada and Virginia may double count where a county department and its affiliated departments both registered (USFA deduplicates these; the download does not flag them).
Source: [1][6] U.S. Fire Administration (FEMA); U.S. Census Bureau
The index runs from 90.2% in South Dakota, 89.0% in Pennsylvania and 88.4% in West Virginia to 9.1% in Florida, 7.0% in Massachusetts and 6.2% in Hawaii. New York's registered departments list 80,346 volunteer firefighters, the most of any state, against 17,593 career firefighters (June 2026 file).
Paid-per-call firefighters change the reading in several Midwestern and New England states. Michigan's registered departments list 14,916 paid-per-call firefighters against 7,343 career and 3,920 volunteer; Wisconsin lists 10,875, Minnesota 9,086 and Maine 5,059. These members are paid when they respond but are not full-time staff, so a low volunteer index in Michigan (15.0%) does not mean a mostly career workforce.
Seven in ten departments, under half the firefighters
All-volunteer departments are numerous but small. All-career departments are few but large, and they employ most of the country's registered career firefighters.
Share of the national registry total held by each department type
Source: Fire Life and Safety count of the USFA National Fire Department Registry download (27,117 departments, last updated June 11, 2026)
| Department type | Departments | Share of departments (%) | Stations | Share of stations (%) | Active firefighters | Share of firefighters (%) | Share of all career firefighters (%) | Average firefighters per department |
|---|---|---|---|---|---|---|---|---|
| Volunteer | 18,952 | 69.9 | 25,025 | 47.6 | 516,577 | 48.4 | 0.0 | 27.3 |
| Mostly volunteer | 4,166 | 15.4 | 9,563 | 18.2 | 192,416 | 18.0 | 9.3 | 46.2 |
| Mostly career | 1,393 | 5.1 | 5,443 | 10.4 | 94,808 | 8.9 | 19.7 | 68.1 |
| Career | 2,606 | 9.6 | 12,541 | 23.9 | 264,222 | 24.7 | 71.0 | 101.4 |
| All types | 27,117 | 100.0 | 52,572 | 100.0 | 1,068,023 | 100.0 | 100.0 | 39.4 |
All 27,117 rows, including 15 departments in U.S. territories. Firefighters include career, volunteer and paid-per-call members.
Source: [1] U.S. Fire Administration (FEMA)
All-volunteer departments average 27.3 active firefighters each and all-career departments 101.4 (June 2026 file). Two in three registered departments (67.6%) run a single station.
The latest NFPA U.S. Fire Department Profile we found, for 2020, reports the same pattern from its own survey: all-career or mostly career departments were 18% of an estimated 29,452 departments but protected 70% of the U.S. population, and 95% of volunteer firefighters served departments protecting fewer than 25,000 people (NFPA). We cite those figures as context only; NFPA's estimates and the registry counts use different methods.
Stations and firefighters per resident, state by state
North Dakota, Wyoming, Arkansas, Alaska and Vermont report the most stations per resident; Florida, Arizona, Texas and California are among the fewest. The ratios describe infrastructure and rosters, not a service standard.
Stations reported by registered departments divided by July 1, 2025 population
Source: USFA National Fire Department Registry (June 2026 file); U.S. Census Bureau Vintage 2025 estimates; Fire Life and Safety calculation
Show all 52 rows
| State | Stations reported | Stations per 100,000 residents | Residents per station | Single-station departments (%) | Population, July 1, 2025 |
|---|---|---|---|---|---|
| Alabama | 1,354 | 26.1 | 3,835 | 67.2 | 5,193,088 |
| Alaska | 287 | 38.9 | 2,569 | 70.3 | 737,270 |
| Arizona | 675 | 8.9 | 11,295 | 48.3 | 7,623,818 |
| Arkansas | 1,267 | 40.7 | 2,458 | 53.4 | 3,114,791 |
| California | 3,784 | 9.6 | 10,400 | 46.7 | 39,355,309 |
| Colorado | 878 | 14.6 | 6,848 | 42.9 | 6,012,561 |
| Connecticut | 545 | 14.8 | 6,768 | 52.8 | 3,688,496 |
| Delaware | 87 | 8.2 | 12,183 | 71.2 | 1,059,952 |
| District of Columbia | 39 | 5.6 | 17,786 | 0.0 | 693,645 |
| Florida | 1,763 | 7.5 | 13,308 | 41.4 | 23,462,518 |
| Georgia | 1,774 | 15.7 | 6,371 | 53.1 | 11,302,748 |
| Hawaii | 115 | 8.0 | 12,459 | 41.7 | 1,432,820 |
| Idaho | 480 | 23.6 | 4,229 | 58.1 | 2,029,733 |
| Illinois | 1,868 | 14.7 | 6,809 | 65.0 | 12,719,141 |
| Indiana | 1,240 | 17.8 | 5,624 | 72.5 | 6,973,333 |
| Iowa | 826 | 25.5 | 3,921 | 94.2 | 3,238,387 |
| Kansas | 894 | 30.0 | 3,330 | 73.3 | 2,977,220 |
| Kentucky | 1,103 | 23.9 | 4,177 | 70.8 | 4,606,864 |
| Louisiana | 1,412 | 30.6 | 3,271 | 25.1 | 4,618,189 |
| Maine | 503 | 35.6 | 2,813 | 68.0 | 1,414,874 |
| Maryland | 610 | 9.7 | 10,271 | 77.9 | 6,265,347 |
| Massachusetts | 796 | 11.1 | 8,988 | 44.6 | 7,154,084 |
| Michigan | 1,500 | 14.8 | 6,752 | 73.1 | 10,127,884 |
| Minnesota | 925 | 15.9 | 6,303 | 85.0 | 5,830,405 |
| Mississippi | 782 | 26.5 | 3,778 | 63.5 | 2,954,160 |
| Missouri | 1,516 | 24.2 | 4,136 | 58.1 | 6,270,541 |
| Montana | 436 | 38.1 | 2,625 | 71.6 | 1,144,694 |
| Nebraska | 473 | 23.4 | 4,266 | 89.7 | 2,018,006 |
| Nevada | 317 | 9.7 | 10,354 | 55.7 | 3,282,188 |
| New Hampshire | 316 | 22.3 | 4,479 | 66.8 | 1,415,342 |
| New Jersey | 1,272 | 13.3 | 7,506 | 62.6 | 9,548,215 |
| New Mexico | 547 | 25.7 | 3,886 | 51.0 | 2,125,498 |
| New York | 2,822 | 14.1 | 7,088 | 70.8 | 20,002,427 |
| North Carolina | 1,819 | 16.2 | 6,156 | 68.0 | 11,197,968 |
| North Dakota | 384 | 48.0 | 2,082 | 88.7 | 799,358 |
| Ohio | 1,774 | 14.9 | 6,708 | 70.7 | 11,900,510 |
| Oklahoma | 1,091 | 26.5 | 3,779 | 74.9 | 4,123,288 |
| Oregon | 712 | 16.7 | 6,002 | 50.2 | 4,273,586 |
| Pennsylvania | 2,398 | 18.4 | 5,446 | 82.6 | 13,059,432 |
| Rhode Island | 153 | 13.7 | 7,284 | 50.0 | 1,114,521 |
| South Carolina | 1,190 | 21.4 | 4,681 | 51.6 | 5,570,274 |
| South Dakota | 348 | 37.2 | 2,687 | 90.1 | 935,094 |
| Tennessee | 1,479 | 20.2 | 4,946 | 60.8 | 7,315,076 |
| Texas | 2,958 | 9.3 | 10,720 | 69.3 | 31,709,821 |
| Utah | 357 | 10.1 | 9,913 | 69.5 | 3,538,904 |
| Vermont | 251 | 38.9 | 2,568 | 79.6 | 644,663 |
| Virginia | 1,150 | 13.0 | 7,722 | 76.2 | 8,880,107 |
| Washington | 1,314 | 16.4 | 6,089 | 36.0 | 8,001,020 |
| West Virginia | 548 | 31.0 | 3,223 | 82.9 | 1,766,147 |
| Wisconsin | 1,051 | 17.6 | 5,683 | 80.4 | 5,972,787 |
| Wyoming | 264 | 44.8 | 2,230 | 71.3 | 588,753 |
| 50 states + DC | 52,447 | 15.3 | 6,517 | 67.6 | 341,784,857 |
Stations are the Number Of Stations field summed by headquarters state. USFA's deduplicated national station total is 52,341; the raw sum across all rows is 52,572.
Source: [1][2][6] U.S. Fire Administration (FEMA); U.S. Fire Administration (FEMA); U.S. Census Bureau
Registered departments in the 50 states and DC report 52,447 stations, or 15.3 per 100,000 residents and one station per 6,517 residents. North Dakota (48.0), Wyoming (44.8) and Arkansas (40.7) report the most stations per 100,000; Florida (7.5) and Hawaii (8.0) report the fewest among the states.
Career, volunteer and paid-per-call firefighters divided by July 1, 2025 population
Source: USFA National Fire Department Registry (June 2026 file); U.S. Census Bureau Vintage 2025 estimates; Fire Life and Safety calculation
Firefighters per 1,000 residents run from 11.08 in North Dakota and 8.48 in South Dakota to 1.50 in California and Arizona and 1.49 in Florida. Residents per career firefighter run from 463 in the District of Columbia and 492 in Rhode Island to 2,248 in Pennsylvania, 2,330 in Delaware and 2,467 in Minnesota, states where volunteer or paid-per-call members carry much of the work.
How complete the registry is, and what replaced it
The registry covers an estimated 91% of U.S. departments, and its final file is now fixed. Its successor listing, NERIS, already shows 13.2% more entities, with almost the same volunteer share.
USFA estimates that the registry lists 91% of U.S. fire departments. Against NFPA's 2020 estimate of 29,452 departments, the 27,117 registered departments equal 92.1%. USFA launched the list in 2001 as the National Fire Department Census, and registrations grew from about 16,000 to over 27,000 by 2016 (USFA).
The registry home page now states that it no longer takes new registrations or updates and that downloads reflect records added or changed before June 2026, pointing users to the NERIS department search run with the Fire Safety Research Institute (USFA; USFA NERIS). That makes the June 2026 file the registry's last snapshot.
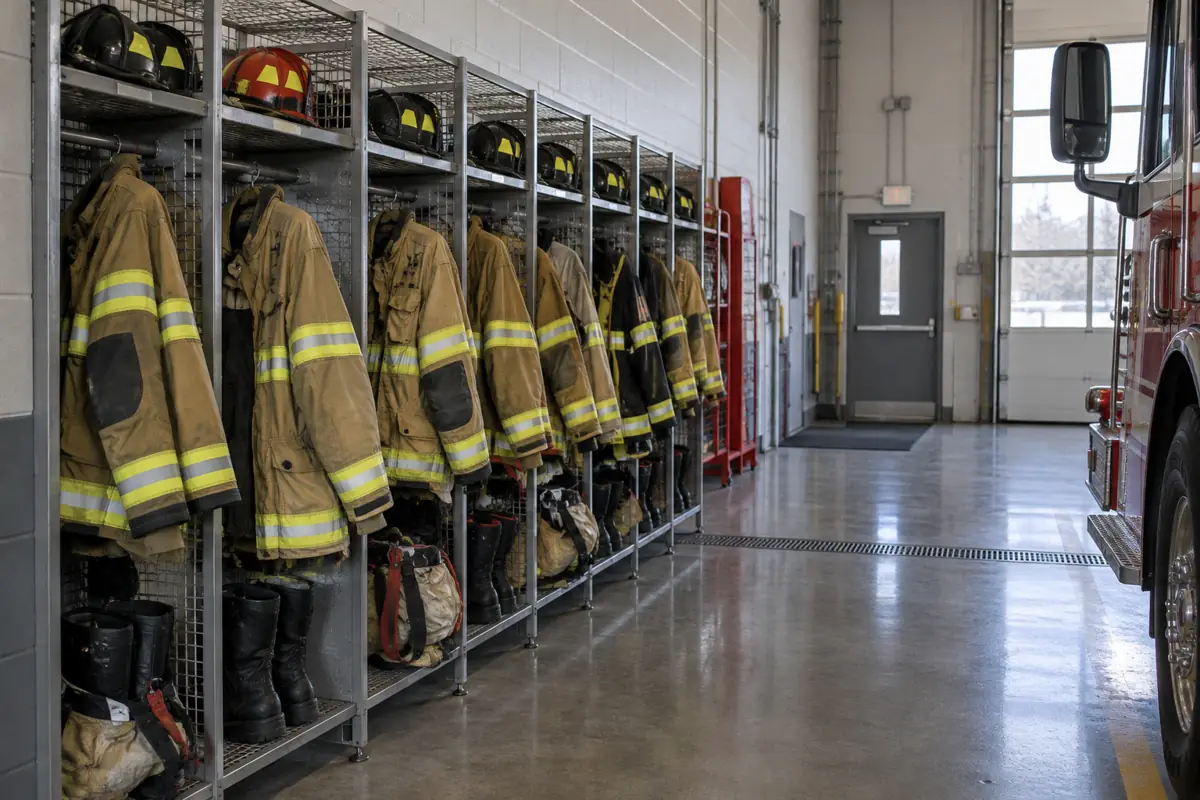
States where the registered count changed by 4 or more departments
Source: USFA National Fire Department Registry Summary, January 2024 (Table 1); Fire Life and Safety count of the June 2026 registry file
Show all 52 rows
| State | Registered, January 2024 (USFA summary) | Registered, June 2026 file (our count) | Change | Change (%) | NERIS listing, October 2026 | NERIS typed volunteer | NERIS typed combination | NERIS typed career | NERIS volunteer share (%) |
|---|---|---|---|---|---|---|---|---|---|
| Alabama | 818 | 821 | 3 | 0.4 | 1,122 | 690 | 94 | 79 | 80.0 |
| Alaska | 154 | 155 | 1 | 0.6 | 150 | 60 | 43 | 13 | 51.7 |
| Arizona | 238 | 238 | 0 | 0.0 | 211 | 41 | 60 | 79 | 22.8 |
| Arkansas | 692 | 696 | 4 | 0.6 | 947 | 612 | 76 | 31 | 85.1 |
| California | 849 | 853 | 4 | 0.5 | 781 | 142 | 237 | 258 | 22.3 |
| Colorado | 309 | 310 | 1 | 0.3 | 336 | 134 | 95 | 48 | 48.4 |
| Connecticut | 246 | 246 | 0 | 0.0 | 263 | 148 | 60 | 31 | 61.9 |
| Delaware | 58 | 59 | 1 | 1.7 | 68 | 22 | 36 | 1 | 37.3 |
| District of Columbia | 3 | 3 | 0 | 0.0 | 4 | 0 | 1 | 1 | 0.0 |
| Florida | 462 | 389 | -73 | -15.8 | 418 | 97 | 83 | 197 | 25.7 |
| Georgia | 463 | 461 | -2 | -0.4 | 527 | 170 | 128 | 101 | 42.6 |
| Hawaii | 12 | 12 | 0 | 0.0 | 10 | 0 | 1 | 6 | 0.0 |
| Idaho | 197 | 198 | 1 | 0.5 | 244 | 116 | 60 | 20 | 59.2 |
| Illinois | 1,106 | 1,107 | 1 | 0.1 | 1,107 | 661 | 185 | 166 | 65.3 |
| Indiana | 762 | 766 | 4 | 0.5 | 834 | 523 | 121 | 83 | 71.9 |
| Iowa | 738 | 739 | 1 | 0.1 | 811 | 597 | 37 | 34 | 89.4 |
| Kansas | 499 | 499 | 0 | 0.0 | 569 | 397 | 68 | 32 | 79.9 |
| Kentucky | 686 | 688 | 2 | 0.3 | 815 | 540 | 110 | 54 | 76.7 |
| Louisiana | 427 | 427 | 0 | 0.0 | 485 | 188 | 164 | 50 | 46.8 |
| Maine | 338 | 341 | 3 | 0.9 | 405 | 242 | 98 | 15 | 68.2 |
| Maryland | 261 | 263 | 2 | 0.8 | 366 | 164 | 77 | 17 | 63.6 |
| Massachusetts | 363 | 363 | 0 | 0.0 | 371 | 81 | 149 | 133 | 22.3 |
| Michigan | 972 | 976 | 4 | 0.4 | 1,010 | 598 | 247 | 96 | 63.5 |
| Minnesota | 722 | 725 | 3 | 0.4 | 767 | 172 | 56 | 17 | 70.2 |
| Mississippi | 419 | 419 | 0 | 0.0 | 725 | 561 | 64 | 52 | 82.9 |
| Missouri | 774 | 755 | -19 | -2.5 | 820 | 497 | 122 | 82 | 70.9 |
| Montana | 281 | 285 | 4 | 1.4 | 343 | 241 | 31 | 14 | 84.3 |
| Nebraska | 389 | 389 | 0 | 0.0 | 465 | 356 | 20 | 10 | 92.2 |
| Nevada | 88 | 88 | 0 | 0.0 | 72 | 24 | 22 | 11 | 42.1 |
| New Hampshire | 211 | 211 | 0 | 0.0 | 231 | 89 | 100 | 24 | 41.8 |
| New Jersey | 712 | 713 | 1 | 0.1 | 721 | 519 | 94 | 61 | 77.0 |
| New Mexico | 247 | 249 | 2 | 0.8 | 295 | 154 | 35 | 26 | 71.6 |
| New York | 1,660 | 1,649 | -11 | -0.7 | 1,785 | 1,485 | 74 | 79 | 90.7 |
| North Carolina | 1,082 | 1,089 | 7 | 0.6 | 1,234 | 572 | 336 | 68 | 58.6 |
| North Dakota | 327 | 327 | 0 | 0.0 | 362 | 290 | 16 | 7 | 92.7 |
| Ohio | 1,137 | 1,148 | 11 | 1.0 | 1,221 | 670 | 296 | 166 | 59.2 |
| Oklahoma | 746 | 749 | 3 | 0.4 | 935 | 644 | 83 | 50 | 82.9 |
| Oregon | 309 | 289 | -20 | -6.5 | 358 | 89 | 140 | 19 | 35.9 |
| Pennsylvania | 1,804 | 1,771 | -33 | -1.8 | 2,234 | 1,546 | 147 | 56 | 88.4 |
| Rhode Island | 69 | 68 | -1 | -1.4 | 67 | 25 | 11 | 25 | 41.0 |
| South Carolina | 441 | 442 | 1 | 0.2 | 508 | 212 | 150 | 48 | 51.7 |
| South Dakota | 294 | 294 | 0 | 0.0 | 342 | 275 | 13 | 8 | 92.9 |
| Tennessee | 638 | 638 | 0 | 0.0 | 682 | 460 | 105 | 59 | 73.7 |
| Texas | 1,520 | 1,530 | 10 | 0.7 | 1,856 | 974 | 239 | 240 | 67.0 |
| Utah | 189 | 190 | 1 | 0.5 | 229 | 101 | 35 | 28 | 61.6 |
| Vermont | 206 | 206 | 0 | 0.0 | 231 | 176 | 17 | 10 | 86.7 |
| Virginia | 556 | 558 | 2 | 0.4 | 574 | 329 | 95 | 48 | 69.7 |
| Washington | 403 | 405 | 2 | 0.5 | 414 | 150 | 161 | 51 | 41.4 |
| West Virginia | 401 | 428 | 27 | 6.7 | 441 | 395 | 24 | 15 | 91.0 |
| Wisconsin | 761 | 762 | 1 | 0.1 | 798 | 555 | 105 | 51 | 78.1 |
| Wyoming | 114 | 115 | 1 | 0.9 | 107 | 20 | 15 | 6 | 48.8 |
| 50 states + DC | 27,153 | 27,102 | -51 | -0.2 | 30,671 | 17,804 | 4,836 | 2,876 | 69.8 |
January 2024 counts are USFA Registry Summary Table 1. June 2026 counts are our count of the download; the registry stopped accepting registrations and updates in June 2026, so this is its final state. NERIS columns are our count of every record in the public NERIS department search on 2026-10-27, by state; NERIS uses three department types, and the volunteer share is volunteer / (volunteer + combination + career), excluding entities with no type.
Source: [1][3][5][9] U.S. Fire Administration (FEMA); U.S. Fire Administration (FEMA); U.S. Fire Administration (FEMA); Fire Safety Research Institute for USFA (NERIS)
Florida's registered count fell from 462 in January 2024 to 389 in the June 2026 file, a 15.8% drop. Pennsylvania (-33), Oregon (-20), Missouri (-19) and New York (-11) also fell, while West Virginia rose by 27. In a voluntary list these changes reflect registrations, removals and record clean-up as well as mergers; they are not a count of departments opening or closing.
We read every record in the public NERIS department search on 2026-10-27: 30,699 entities, 30,671 of them in the 50 states and DC. That is 13.2% more than the registry's final file, and NERIS lists more entities than the registry in 43 of 51 jurisdictions. The widest gap is Mississippi (725 NERIS entities vs 419 registered departments); Nevada is the one notable case in the other direction (72 vs 88).
NERIS types departments as career, combination or volunteer, and 5,173 entities have no type yet. Among typed entities in the 50 states and DC, 69.8% are volunteer, against 69.9% all-volunteer departments in the registry file. The two lists were built separately, so the matching share is a useful check that the registry's staffing mix still holds. Of the NERIS records, 21,324 were last modified in 2026.
Checking registry career counts against BLS payroll data
Registry career counts come close to BLS paid-job estimates in most states, which supports using the registry for state comparisons. The gaps are largest where paid-per-call rosters are large.
Show all 52 rows
| State | Registry career firefighters | BLS OEWS firefighters (33-2011) | BLS OEWS fire supervisors (33-1021) | BLS paid total | Registry career / BLS paid total |
|---|---|---|---|---|---|
| Alabama | 6,725 | 7,260 | 1,440 | 8,700 | 0.77 |
| Alaska | 1,382 | 1,040 | 310 | 1,350 | 1.02 |
| Arizona | 8,778 | 7,500 | 2,670 | 10,170 | 0.86 |
| Arkansas | 3,134 | 2,480 | 920 | 3,400 | 0.92 |
| California | 44,463 | 31,470 | 8,170 | 39,640 | 1.12 |
| Colorado | 6,981 | 6,510 | 1,900 | 8,410 | 0.83 |
| Connecticut | 4,351 | 2,970 | 1,310 | 4,280 | 1.02 |
| Delaware | 455 | 560 | n/a | n/a | n/a |
| District of Columbia | 1,497 | 1,480 | 380 | 1,860 | 0.80 |
| Florida | 30,614 | 24,570 | 9,540 | 34,110 | 0.90 |
| Georgia | 14,469 | 12,700 | 3,730 | 16,430 | 0.88 |
| Hawaii | 2,421 | n/a | n/a | n/a | n/a |
| Idaho | 2,251 | 2,240 | 520 | 2,760 | 0.82 |
| Illinois | 15,862 | 18,400 | 3,240 | 21,640 | 0.73 |
| Indiana | 8,749 | 8,530 | 1,290 | 9,820 | 0.89 |
| Iowa | 2,103 | 2,170 | 600 | 2,770 | 0.76 |
| Kansas | 3,679 | 3,360 | 1,450 | 4,810 | 0.76 |
| Kentucky | 4,860 | 5,150 | 1,250 | 6,400 | 0.76 |
| Louisiana | 6,707 | 5,230 | 1,810 | 7,040 | 0.95 |
| Maine | 1,444 | 2,480 | 410 | 2,890 | 0.50 |
| Maryland | 9,112 | 5,340 | 2,380 | 7,720 | 1.18 |
| Massachusetts | 12,850 | 11,940 | 3,370 | 15,310 | 0.84 |
| Michigan | 7,343 | 6,610 | 1,830 | 8,440 | 0.87 |
| Minnesota | 2,363 | 5,810 | 1,120 | 6,930 | 0.34 |
| Mississippi | 3,602 | 2,920 | 1,550 | 4,470 | 0.81 |
| Missouri | 7,494 | 6,580 | 1,950 | 8,530 | 0.88 |
| Montana | 825 | 1,010 | 320 | 1,330 | 0.62 |
| Nebraska | 1,550 | 1,070 | 370 | 1,440 | 1.08 |
| Nevada | 3,109 | 2,640 | 1,080 | 3,720 | 0.84 |
| New Hampshire | 1,794 | 2,700 | 450 | 3,150 | 0.57 |
| New Jersey | 7,357 | 7,500 | 2,210 | 9,710 | 0.76 |
| New Mexico | 2,628 | 2,420 | 820 | 3,240 | 0.81 |
| New York | 17,593 | 12,950 | 4,100 | 17,050 | 1.03 |
| North Carolina | 12,204 | 19,410 | 5,050 | 24,460 | 0.50 |
| North Dakota | 706 | 820 | 130 | 950 | 0.74 |
| Ohio | 15,682 | 18,100 | 3,960 | 22,060 | 0.71 |
| Oklahoma | 4,824 | 4,150 | 2,000 | 6,150 | 0.78 |
| Oregon | 4,187 | 3,790 | 1,160 | 4,950 | 0.85 |
| Pennsylvania | 5,810 | 5,020 | 1,340 | 6,360 | 0.91 |
| Rhode Island | 2,263 | 1,620 | 770 | 2,390 | 0.95 |
| South Carolina | 7,295 | 7,780 | 1,450 | 9,230 | 0.79 |
| South Dakota | 601 | 610 | 120 | 730 | 0.82 |
| Tennessee | 7,967 | 7,020 | 2,210 | 9,230 | 0.86 |
| Texas | 29,482 | 28,170 | 8,660 | 36,830 | 0.80 |
| Utah | 2,584 | 2,870 | 770 | 3,640 | 0.71 |
| Vermont | 371 | n/a | 90 | n/a | n/a |
| Virginia | 11,747 | 11,160 | 3,300 | 14,460 | 0.81 |
| Washington | 9,195 | 7,560 | 3,350 | 10,910 | 0.84 |
| West Virginia | 1,089 | 900 | 180 | 1,080 | 1.01 |
| Wisconsin | 4,825 | 8,120 | 1,330 | 9,450 | 0.51 |
| Wyoming | 588 | 680 | 150 | 830 | 0.71 |
| States with both BLS cells published (48 incl. DC) | 366,718 | 342,810 | 98,420 | 441,230 | 0.83 |
BLS OEWS May 2025 employment for firefighters (33-2011) plus first-line supervisors of firefighting and prevention workers (33-1021). n/a where BLS suppressed a cell. A ratio below 1 means BLS counts more paid firefighter jobs than the registry lists as career firefighters; paid-per-call members, part-time jobs and unregistered departments all contribute.
Source: [1][7] U.S. Fire Administration (FEMA); U.S. Bureau of Labor Statistics
BLS estimates 342,810 firefighter jobs and 98,420 fire supervisor jobs in the 48 jurisdictions where both May 2025 cells are published. Registered departments in those jurisdictions list 366,718 career firefighters, a ratio of 0.83.
The lowest ratios are in Minnesota (0.34), Maine (0.50), North Carolina (0.50) and Wisconsin (0.51), all states with large paid-per-call rosters in the registry. BLS counts any paid job, including part-time and on-call pay, while the registry places those members in a separate paid-per-call column. California (1.12) and Maryland (1.18) list more registry career firefighters than BLS jobs; Maryland is one of the four states where USFA removes double registrations of county departments and their affiliates, which the download does not flag.
What the staffing model means for building owners and managers
Whether a local department is career or volunteer does not by itself decide who inspects a building. State law assigns inspection duties, and only about a third of registered departments report doing inspections at all.
USFA's registry summary reports that 35.3% of registered departments provide fire inspection or code enforcement and 65.4% provide fire and injury prevention or public education (last updated June 11, 2026). The download does not include these service fields by department, so they cannot be mapped by state.
- Florida: each county, municipality and special district with firesafety enforcement responsibilities must employ or contract with a firesafety inspector, and those inspections must be done by a person certified as meeting State Fire Marshal training requirements, which include a firesafety inspector program of at least 200 hours or equivalent training from another state (Fla. Stat. 633.216, 2026 Florida Statutes). See Florida fire inspection rules.
- Texas: a county fire marshal may inspect structures for fire or life safety hazards and must inspect when called on, but may not enforce orders inside a municipality without an interlocal agreement (Tex. Local Gov't Code 352.016 and 352.019). See Texas fire inspection rules.
- North Carolina: the local inspection department may make periodic inspections for hazardous conditions, subject to the governing board's direction (G.S. 160D-1117). See North Carolina fire inspection rules.
For other states, including New York and Georgia, our state pages and the requirement finder summarize which inspections apply to a building type. Pay for the people who do this work is covered in our fire inspector salary by state report.
Federal staffing support also reaches volunteer departments directly: FEMA's SAFER grants fund fire departments and volunteer firefighter interest organizations to increase or maintain the number of trained front line firefighters (FEMA).
Key findings
- The USFA National Fire Department Registry file (last updated June 11, 2026) lists 27,117 fire departments in the U.S. and its territories, matching USFA's own Quick Facts total.[1][2]
- Of those 27,117 departments, 18,952 (69.9%) are all-volunteer, 4,166 (15.4%) mostly volunteer, 1,393 (5.1%) mostly career and 2,606 (9.6%) all-career, using the registry's department type field (June 2026 file).[1]
- Registered departments report 1,068,023 active firefighters: 372,343 career, 561,886 volunteer and 133,794 paid-per-call (June 2026 file, all rows).[1]
- Volunteers are 52.6% of registered active firefighters nationally (June 2026 file), the same share USFA reported in January 2024.[1][5]
- South Dakota has the highest volunteer reliance index at 90.2%, followed by Pennsylvania (89.0%) and West Virginia (88.4%) (June 2026 registry file).[1]
- Florida (9.1%), Massachusetts (7.0%) and Hawaii (6.2%) have the lowest volunteer reliance among the states; the District of Columbia reports no volunteer firefighters (June 2026 registry file).[1]
- Nebraska has the highest all-volunteer share of registered departments at 92.3%, followed by North Dakota (92.0%) and South Dakota (91.8%) (June 2026 registry file).[1]
- Pennsylvania has the most registered departments (1,771), followed by New York (1,649) and Texas (1,530) (June 2026 registry file).[1]
- The 50 states and DC have 15.3 registered fire stations per 100,000 residents, ranging from 48.0 in North Dakota to 7.5 in Florida among the states (registry June 2026; population July 1, 2025).[1][6]
- The 50 states and DC have 3.12 registered active firefighters per 1,000 residents, ranging from 11.08 in North Dakota to 1.49 in Florida (registry June 2026; population July 1, 2025).[1][6]
- There are 924 residents per registered career firefighter in the 50 states and DC, from 463 in the District of Columbia to 2,467 in Minnesota (registry June 2026; population July 1, 2025).[1][6]
- All-career departments are 9.6% of registered departments but employ 71.0% of registered career firefighters and operate 23.9% of stations (June 2026 file).[1]
- In the 48 jurisdictions where BLS publishes both cells, registry career firefighters (366,718) equal 0.83 of BLS paid firefighter and supervisor jobs (441,230) for May 2025.[1][7]
- Nationally, 35.3% of registered departments report providing fire inspection or code enforcement services, according to USFA's registry summary (last updated June 11, 2026).[2]
- The NERIS department search, the registry's successor, listed 30,671 entities in the 50 states and DC on 2026-10-27, 13.2% more than the registry file; 69.8% of typed NERIS entities are volunteer, against 69.9% in the registry.[9][1]
Summary for decision makers
- The final USFA registry file lists 27,117 fire departments, which USFA estimates is 91% of all U.S. departments; 27,102 are in the 50 states and DC.
- All-volunteer departments are the majority of registered departments in 38 of 51 jurisdictions, and 69.9% of departments nationally.
- Counting people instead of departments changes the picture: volunteers are 52.6% of the 1,068,023 registered active firefighters, and a majority in 28 of 51 jurisdictions.
- All-career departments are 9.6% of departments but hold 23.9% of stations and 71.0% of all registered career firefighters.
- Per resident, North Dakota leads: it reports 48.0 stations per 100,000 residents and 11.08 firefighters per 1,000, against 15.3 and 3.12 for the 50 states and DC.
- Registry career counts equal 0.83 of BLS paid firefighter and supervisor jobs in the 48 jurisdictions BLS publishes, so the registry undercounts paid staff in some states, most where paid-per-call rosters are large.
- The registry stopped accepting registrations and updates in June 2026; between January 2024 and the final file, the 50-state and DC count fell by 51 departments, led by Florida (-73).
- The successor NERIS listing (October 2026) shows 13.2% more entities than the registry in the 50 states and DC, but nearly the same volunteer share: 69.8% of typed entities.
Questions people ask
How many fire departments are in the US?
The USFA registry's final file lists 27,117 registered fire departments (last updated June 11, 2026), 27,102 of them in the 50 states and DC. Registration is voluntary; USFA estimates the list covers 91% of departments, and NFPA estimated 29,452 departments in 2020.
What percentage of firefighters are volunteers?
Volunteers are 52.6% of the 1,068,023 active firefighters reported by registered departments in the June 2026 file. Career firefighters are 372,343 and paid-per-call firefighters 133,794. NFPA's 2020 estimate was 676,900 volunteers and 364,300 career firefighters.
Career vs volunteer firefighters: which states rely most on volunteers?
By our volunteer reliance index, South Dakota (90.2%), Pennsylvania (89.0%), West Virginia (88.4%), North Dakota (86.2%), Delaware (85.5%) and Nebraska (85.5%) rely most on volunteers (June 2026 registry file).
Which state has the most volunteer fire departments?
Pennsylvania has the most all-volunteer registered departments (1,589), followed by New York (1,497) and Texas (1,071) (June 2026 registry file). By share, Nebraska leads at 92.3% of its departments.
For journalists and researchers
If you cite only a few, cite these
- 27,117 registered U.S. fire departments, 69.9% all-volunteer (USFA registry file, June 2026).[1]
- Volunteers are 52.6% of registered active firefighters nationally, and a majority in 28 of 51 jurisdictions (June 2026 file).[1]
- 15.3 registered fire stations per 100,000 residents in the 50 states and DC (registry June 2026, Census July 1, 2025).[1][6]
Most quotable statistics
- The final USFA registry file lists 27,117 U.S. fire departments; 69.9% are all-volunteer (June 2026).[1]
- Volunteers are 52.6% of the 1,068,023 active firefighters reported by registered U.S. fire departments (June 2026 file).[1]
- All-career departments are 9.6% of registered U.S. fire departments but employ 71.0% of registered career firefighters (June 2026 file).[1]
- North Dakota reports 48.0 registered fire stations per 100,000 residents; Florida reports 7.5 (registry June 2026, population July 1, 2025).[1][6]
- South Dakota's volunteer reliance index is 90.2%: nine in ten registered firefighters there are volunteers (June 2026 file).[1]
- Florida's registered fire department count fell from 462 in January 2024 to 389 in the final June 2026 registry file.[1][5]
Press summary
Fire Life and Safety counted every one of the 27,117 fire departments in the U.S. Fire Administration's National Fire Department Registry, using the file published after the registry stopped accepting updates in June 2026, and joined it to Census and BLS data. Nationally, 69.9% of registered departments are all-volunteer, but volunteers are 52.6% of the 1,068,023 registered active firefighters, because all-career departments, 9.6% of departments, employ 71.0% of registered career firefighters. Our volunteer reliance index ranges from 90.2% in South Dakota to 6.2% in Hawaii. The 50 states and DC report 15.3 stations per 100,000 residents and 3.12 firefighters per 1,000, with North Dakota highest on both. Registry career counts equal 0.83 of BLS paid firefighter jobs, a gap concentrated in states with large paid-per-call rosters. Registration is voluntary, so all counts are a floor.
Suggested headlines
- Seven in ten U.S. fire departments are all-volunteer, but volunteers are 52.6% of firefighters
- Final USFA registry file counts 27,117 fire departments before the list moves to NERIS
- South Dakota, Pennsylvania and West Virginia lean most on volunteer firefighters
- North Dakota has 48.0 fire stations per 100,000 residents; Florida has 7.5
- Florida's registered fire department count fell by 73 between 2024 and 2026
How to cite this report
Fire Life and Safety. (2026). Volunteer Fire Departments by State: Career vs Volunteer Counts From the Final 2026 Registry File. Retrieved from https://firelifeandsafety.com/reports/fire-departments-by-state/
Reuse license
Data and tables are licensed CC BY 4.0. Attribution: “Source: Fire Life and Safety, Volunteer Fire Departments by State: Career vs Volunteer Counts From the Final 2026 Registry File” with a link to this page.
Download the data
Every table in this report is available as a CSV under CC BY 4.0. The fact sheet lists each value with its source URL and access date.
Frequently asked questions
How many volunteer fire departments are there in the US?
The USFA registry's June 2026 file lists 18,952 all-volunteer departments and 4,166 mostly volunteer departments out of 27,117 registered departments. Because registration is voluntary, the true number is higher.
How many fire stations are there in the US?
Registered departments report 52,572 stations in the June 2026 file. USFA's deduplicated figure, which avoids counting county and affiliate stations twice in Georgia, Maryland, Nevada and Virginia, is 52,341.
Which state has the most fire departments?
Pennsylvania, with 1,771 registered departments in the June 2026 file, followed by New York (1,649) and Texas (1,530).
Which state has the fewest volunteer firefighters relative to its workforce?
Among the states, Hawaii (6.2%), Massachusetts (7.0%) and Florida (9.1%) have the lowest volunteer reliance index. The District of Columbia reports no volunteer firefighters (June 2026 registry file).
What is a combination fire department?
A department with both career and volunteer firefighters. The registry splits them into mostly career (51% to 99% career firefighters) and mostly volunteer (1% to 50% career). The June 2026 file lists 1,393 mostly career and 4,166 mostly volunteer departments.
What are paid-per-call firefighters?
Firefighters paid for the calls they respond to rather than a salary. Registered departments report 133,794 of them in the June 2026 file, with the largest rosters in Michigan (14,916), Wisconsin (10,875) and Minnesota (9,086).
Is the National Fire Department Registry still updated?
No. USFA states that the registry no longer accepts registrations or updates and that downloads reflect records added or changed before June 2026, and it points users to the NERIS department search. Its last update date is June 11, 2026. NERIS listed 30,699 entities on 2026-10-27.
How many firefighters are there per 1,000 people in the US?
Registered departments report 3.12 active firefighters per 1,000 residents in the 50 states and DC, using July 1, 2025 Census population. The ratio is 11.08 in North Dakota and 1.49 in Florida.
Do volunteer fire departments do building inspections?
Some do, but inspection duties are set by state and local law. USFA reports that 35.3% of registered departments provide fire inspection or code enforcement. In Florida, for example, inspections required by law must be done by a certified firesafety inspector.
Why did Florida's registered fire department count drop?
Florida's registered count fell from 462 in January 2024 to 389 in the June 2026 file. The registry does not record reasons; removals, mergers and record clean-up in a voluntary list can all reduce the count.
Methodology
Selection: the primary dataset is the USFA National Fire Department Registry national download (usfa-registry-national.csv), fetched from https://apps.usfa.fema.gov/registry/api/download/national on 2026-10-27. USFA's Quick Facts page shows the registry was last updated June 11, 2026, and the registry home page states it no longer accepts registrations or updates. We used it because it is the only department-level public file with department type, stations and firefighter counts for every state. Population is the Census Bureau Vintage 2025 state estimate for July 1, 2025. Paid firefighter employment is BLS OEWS May 2025 (occupations 33-2011 and 33-1021).
Counting rules: every row is counted once by its headquarters state and by the registry's Dept Type field as published, including 82 departments that reported zero firefighters. USFA's own Quick Facts exclude 89 departments without personnel counts, so its type shares (69.8% volunteer) differ slightly from ours (69.9%). Territory rows (15 departments in Puerto Rico, Guam and the Northern Mariana Islands) are in national totals but not in state rankings.
Conflicts: our raw sums (52,572 stations; 372,343 career, 561,886 volunteer and 133,794 paid-per-call firefighters) are slightly higher than USFA's published totals (52,341 stations; 370,891, 550,782 and 133,707) because USFA removes double registrations of county departments and their affiliates in Georgia, Maryland, Nevada and Virginia. The download does not flag those records, so state figures for those four states may be overstated; we report the raw counts and flag the states in table notes. NFPA's 2020 profile figures are survey estimates with a different scope (municipal departments only for career firefighters) and are shown as context, never mixed into our calculations.
NERIS comparison: we read all 307 pages (100 records each) of the public NERIS department search at https://neris.fsri.org/departments on 2026-10-27 with a 1.5-second pause between requests, saved each page unmodified (gzipped) in raw/neris_pages/, and counted records by state and department type (scripts/fetch_neris.py, scripts/analyze_neris.py). No duplicate NERIS IDs were found. NERIS is used only as a cross-check; all state rankings use the registry file.
Derived metrics: volunteer reliance index, stations per 100,000 residents, firefighters per 1,000 residents, residents per career firefighter, departments per 100,000 residents, department-vs-people shares by type, the registry-to-BLS ratio and registry coverage. Formulas, inputs and results are in derived_metrics.csv and the table CSVs; scripts/analyze_registry.py reproduces every table from the raw files.
Limitations: registration is voluntary and self-reported, and USFA estimates 91% coverage, so all counts are a floor. Volunteer rosters measure membership, not on-duty staffing or response capacity. The registry's specialized-services answers (including fire inspection) are published only as national percentages. Changes between January 2024 and June 2026 reflect a voluntary list's additions and removals, not openings or closures.
Source copies: every page was fetched directly from its publisher without proxies. Three official pages could not be fetched directly or render only in a browser (ncleg.gov returns 403; the Texas statutes site and FEMA's SAFER page serve a script shell or 403), so we cite Internet Archive captures of the official pages: G.S. 160D-1117 (2026-01-03), Texas Local Government Code Chapter 352 (2025-12-11) and FEMA SAFER (2026-10-13). Copies are in raw/pages/.
Legal notice: the statute summaries in this report describe who may inspect buildings in three states as of the dates shown. They are not legal advice; check the current law and your local fire official for requirements that apply to a specific building.
Last updated 2026-10-27. Because the registry is closed, this report will be rechecked when USFA or NERIS publishes a new department-level file.
This report presents published data with its limitations. It is not legal, engineering, financial or investment advice. Requirements depend on the code edition your state and local fire marshal have adopted; confirm with your authority having jurisdiction.
Sources, ranked by quality
Tier 1: primary and official sources (13)
- [1] U.S. Fire Administration (FEMA). National Fire Department Registry, national download file (usfa-registry-national.csv). Registry records added or changed before June 2026; registry last updated 2026-06-11. Accessed 2026-10-27.
- [2] U.S. Fire Administration (FEMA). National Fire Department Registry Quick Facts. Registry last updated 2026-06-11. Accessed 2026-10-27.
- [3] U.S. Fire Administration (FEMA). National Fire Department Registry (home page notice). Notice live 2026-10-27. Accessed 2026-10-27.
- [4] U.S. Fire Administration (FEMA). About the National Fire Department Registry. 2001 to 2016 history. Accessed 2026-10-27.
- [5] U.S. Fire Administration (FEMA). National Fire Department Registry Summary, January 2024. January 2024. Accessed 2026-10-27.
- [6] U.S. Census Bureau. Annual Estimates of the Resident Population for the States, Vintage 2025 (NST-EST2025-ALLDATA). July 1, 2025 estimates (Vintage 2025). Accessed 2026-10-27.
- [7] U.S. Bureau of Labor Statistics. Occupational Employment and Wage Statistics, May 2025 state estimates. May 2025. Accessed 2026-10-27.
- [9] Fire Safety Research Institute for USFA (NERIS). NERIS National Fire Department and Emergency Services Search Tool. Listing read 2026-10-27 (all 307 pages, 100 records per page). Accessed 2026-10-27.
- [10] U.S. Fire Administration (FEMA). National Emergency Response Information System (NERIS). Page dated 2026-08-27. Accessed 2026-10-27.
- [11] Florida Legislature. Florida Statutes s. 633.216, Inspection of buildings and equipment. 2026 Florida Statutes. Accessed 2026-10-27.
- [12] Texas Legislature. Texas Local Government Code, Chapter 352, County Fire Protection (Internet Archive capture of statutes.capitol.texas.gov, 2025-12-11). Statute text as captured 2025-12-11. Accessed 2026-10-27.
- [13] North Carolina General Assembly. North Carolina General Statutes s. 160D-1117, Periodic inspections (Internet Archive capture of ncleg.gov, 2026-01-03). Statute text as captured 2026-01-03. Accessed 2026-10-27.
- [14] FEMA. Staffing for Adequate Fire and Emergency Response (SAFER) grants (Internet Archive capture, 2026-10-13). Program page as captured 2026-10-13. Accessed 2026-10-27.
Tier 2: trade bodies, market research, company data (1)
- [8] National Fire Protection Association. U.S. Fire Department Profile (2020 data). 2020 (published 2022). Accessed 2026-10-27.
Tier 3: journalism and expert commentary (2)
- [15] FireRescue1. NFPA reports on number of firefighters, departments. 2013 article. Accessed 2026-10-27.
- [16] Firehouse Magazine. 2015 Volunteer Run Survey. 2015 survey. Accessed 2026-10-27.