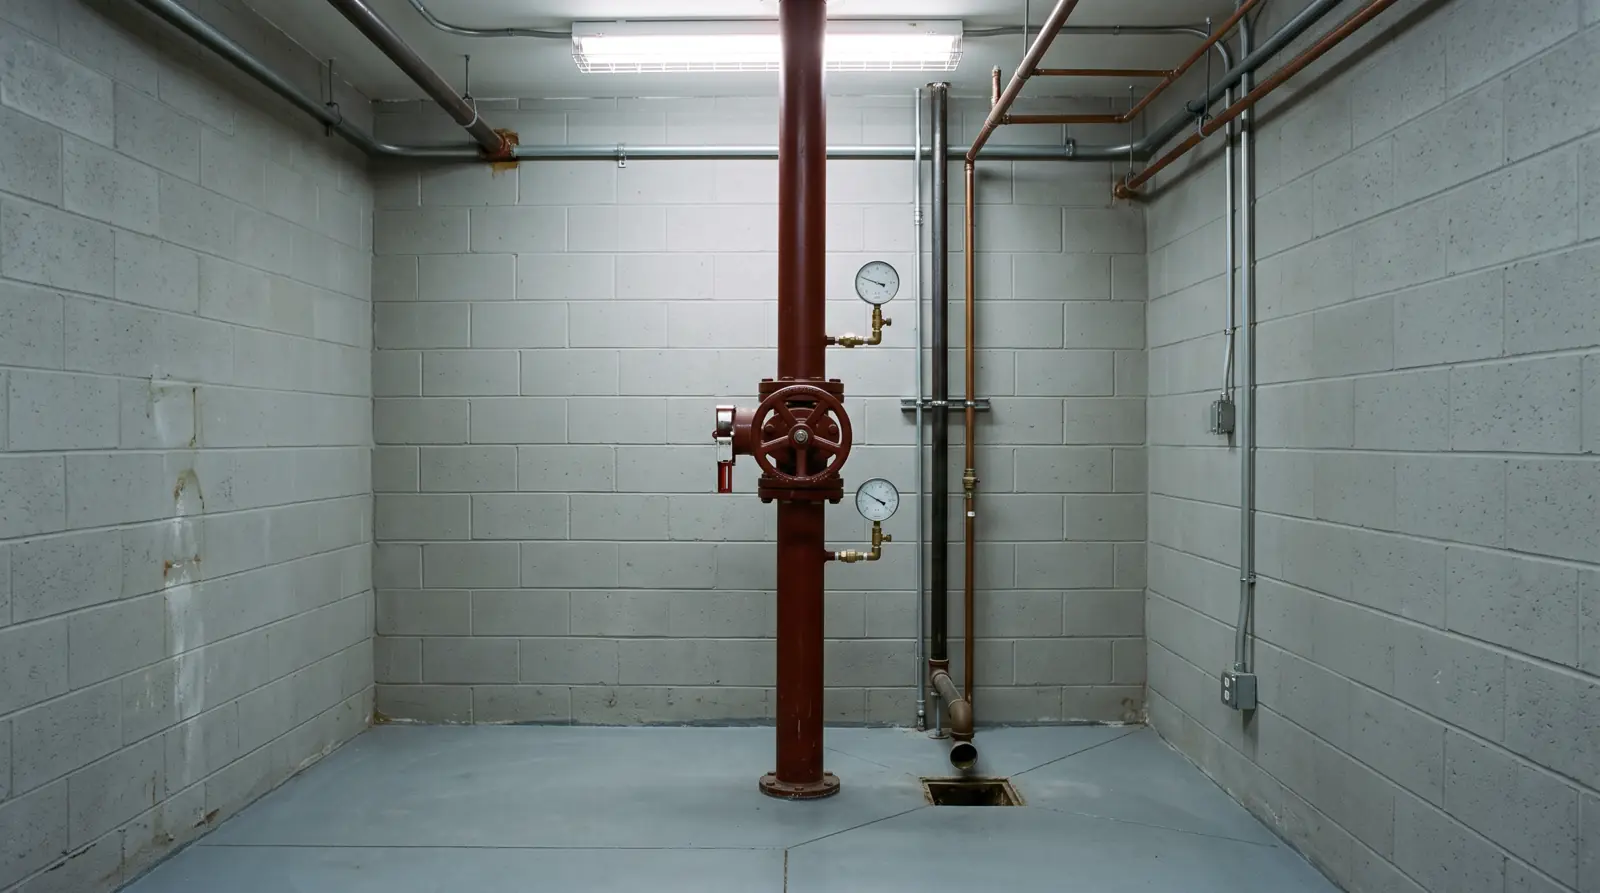
Fire Sprinkler Failure Rate in U.S. Building Fires, 2020 to 2025
- Primary data
- FEMA/USFA NFIRS Fire and Hazardous Materials Public Data Release, 2020 to 2025 (fireincident joined to basicincident)
- Data period
- 2020-2024 complete years; 2025 partial (NERIS transition)
- Latest release used
- 2026-05-01
- Next release
- None: 2025 is the final NFIRS release; reporting moved to NERIS in January 2026
- Geography
- United States, fire departments reporting to NFIRS (not a census)
- Sources
- 18 (17 Tier 1)
In 2020 to 2024 NFIRS building fires, the fire sprinkler failure rate was 14.0 percent: of 17,456 sprinklered fires large enough to activate a system, sprinklers operated in 86.0 percent and operated effectively in 82.7 percent. Leaving out fires outside the protected area, the failure rate falls to 9.5 percent, and a shut-off system is the leading known cause.
Fire sprinkler failure rate in NFIRS building fires, 2020 to 2024
Across five complete NFIRS years, sprinklers failed to operate in 14.0 percent of the fires large enough to set them off and operated without controlling the fire in another 3.3 percent. The yearly rate moved within a narrow band, from 12.8 to 15.1 percent.
Large enough to activate: A sprinkler fire coded as operated and effective (AES_OPER 1), operated and not effective (2) or failed to operate (4). Fires coded too small to activate (3), other (0) or undetermined are not part of the rate. The NFIRS Complete Reference Guide defines effective as the system at least containing and controlling the fire until the fire department completes extinguishment.
From 2020 to 2024, fire departments reported 730,147 nonconfined building fires to NFIRS in our analysis universe (NFIRS Public Data Release). Sprinklers were coded present in 30,244 of them. In 10,491 of those sprinkler fires, the fire was too small to activate the system, which leaves 17,456 fires where the sprinklers had a chance to work.
Of those 17,456 fires, sprinklers operated and were effective in 14,440 (82.7 percent), operated but were not effective in 578 (3.3 percent) and failed to operate in 2,438 (14.0 percent). When sprinklers did operate, they were effective 96.2 percent of the time.
| Year | Building fires in NFIRS sample | AES presence undetermined (%) | Sprinkler fires | Sprinklered share, known status (%) | Sprinkler fires large enough to activate | Operated (%) | Operated and effective (%) | Failed to operate (%) | Operated and effective, excl. outside-area (%) | Failed, excl. outside-area (%) |
|---|---|---|---|---|---|---|---|---|---|---|
| 2020 | 134,067 | 9.5 | 5,588 | 4.6 | 3,083 | 87.2 | 83.7 | 12.8 | 89.2 | 8.1 |
| 2021 | 133,214 | 8.7 | 5,233 | 4.3 | 3,076 | 87.2 | 83.6 | 12.8 | 89.0 | 8.1 |
| 2022 | 151,940 | 9.2 | 5,986 | 4.3 | 3,479 | 86.0 | 82.9 | 14.0 | 87.4 | 10.3 |
| 2023 | 159,615 | 10.3 | 6,854 | 4.8 | 4,005 | 84.9 | 81.4 | 15.1 | 86.9 | 10.6 |
| 2024 | 151,311 | 11.4 | 6,583 | 4.9 | 3,813 | 85.4 | 82.4 | 14.6 | 87.8 | 9.7 |
| 2025 (partial, see note) | 127,568 | 11.4 | 5,704 | 5.0 | 3,249 | 86.4 | 83.3 | 13.6 | 88.4 | 9.2 |
| 2020-2024 pooled | 730,147 | 9.9 | 30,244 | 4.6 | 17,456 | 86.0 | 82.7 | 14.0 | 88.0 | 9.5 |
Sprinkler fires = AES present and type wet, dry or other sprinkler. 'Large enough' = operated (effective or not) or failed to operate; fires too small to activate, 'other' and undetermined are left out of the rate. 2025 is incomplete: December 2025 building fires were 52.7 percent of December 2024 as departments moved to NERIS.
Source: [2][3][4][5][6][7] FEMA, U.S. Fire Administration, National Fire Data Center; FEMA, U.S. Fire Administration, National Fire Data Center; FEMA, U.S. Fire Administration, National Fire Data Center; FEMA, U.S. Fire Administration, National Fire Data Center; FEMA, U.S. Fire Administration, National Fire Data Center; FEMA, U.S. Fire Administration, National Fire Data Center
Sprinkler fires large enough to activate, NFIRS building fires, percent
Source: FLS analysis of FEMA/USFA NFIRS Public Data Releases 2020 to 2024 (nonconfined building fires)
The 'as coded' rate counts every fire the reporting officer marked as a failure, including 1,041 fires where the failure reason was 'fire not in area protected by the system'. A sprinkler cannot be expected to control a fire it does not cover, so the table also shows a version without those fires: 88.0 percent operated and effective and 9.5 percent failed in 2020 to 2024. That second version lands within about one point of NFPA's published national estimates.
Which fires count: confined fires, building types and unknowns
AES fields are filled in consistently only for nonconfined building fires. Confined fires make up 50.3 percent of structure fires but only 29.3 percent of them carried a Fire Module, so they are counted separately and left out of every rate.
The brief covers structure fires, NFIRS incident types 111 to 123. Confined fires (types 113 to 118: cooking fires confined to a container, chimney fires, trash fires and similar) do not require the Fire Module, and the USFA analysis guidelines say AES data come entirely from that module and that confined fires should be removed from AES analysis. From 2020 to 2024 there were 792,455 confined fires; 232,484 had a Fire Module and 7,365 had an AES coded present.
The universe follows the USFA building-fire definition: incident types 111 and 120 to 123, structure type 1 (enclosed building) or 2 (fixed portable or mobile structure), mutual or automatic aid given removed so a fire is not counted twice, and every incident listed for exclusion in each year's errata addendum removed. Type 112 (fires in structures other than buildings) falls outside that definition.
| Year | Structure fires (INC_TYPE 111-123) | Confined fires (113-118) | Confined fires with a Fire Module | Confined fires with AES coded present | Nonconfined building-fire incident types (111, 120-123) | Analysis universe (enclosed or portable buildings) |
|---|---|---|---|---|---|---|
| 2020 | 300,796 | 157,171 | 45,322 | 1,594 | 135,106 | 134,067 |
| 2021 | 287,650 | 144,453 | 49,034 | 1,441 | 134,349 | 133,214 |
| 2022 | 327,988 | 164,068 | 53,763 | 1,582 | 153,270 | 151,940 |
| 2023 | 343,632 | 172,245 | 47,156 | 1,488 | 161,017 | 159,615 |
| 2024 | 316,801 | 154,518 | 37,209 | 1,260 | 152,640 | 151,311 |
| 2025 (partial) | 287,872 | 149,329 | 24,718 | 896 | 128,794 | 127,568 |
Confined fires (113 to 118) need no Fire Module, so AES fields are mostly blank; USFA's guidance is to analyze AES on nonconfined fires only. The universe also requires structure type 1 (enclosed building) or 2 (portable or mobile structure).
Source: [2][3][4][5][6][7][9] FEMA, U.S. Fire Administration, National Fire Data Center; FEMA, U.S. Fire Administration, National Fire Data Center; FEMA, U.S. Fire Administration, National Fire Data Center; FEMA, U.S. Fire Administration, National Fire Data Center; FEMA, U.S. Fire Administration, National Fire Data Center; FEMA, U.S. Fire Administration, National Fire Data Center; U.S. Fire Administration
Presence was coded undetermined in 9.9 percent of universe fires and no fires had it blank. Among fires with known status, any AES was present in 8.2 percent and a coded sprinkler system in 4.6 percent. A further 17,414 fires (32.4 percent of present-AES fires) had the system type left blank; the coding guide makes type required only when the fire was within the system's designed range, so these are read as fires the system was not positioned to fight and are not counted as sprinkler fires.
Wet pipe, dry pipe and special hazard systems
Dry pipe sprinklers failed to operate in 20.9 percent of large-enough fires, against 13.0 percent for wet pipe systems, a gap of 7.9 points.
Wet pipe systems were the system in 26,643 present-AES fires and operated and were effective in 84.0 percent of those large enough to activate. Dry pipe systems operated and were effective in 75.9 percent. Other sprinkler systems (deluge and pre-action) came in at 56.6 percent on a small base of 325 fires.
| System type (AES_TYPE) | Fires with system present | Large enough to activate | Operated (%) | Operated and effective (%) | Failed to operate (%) | Operated, not effective (%) | Effective when operated (%) | Operated and effective, excl. outside-area (%) |
|---|---|---|---|---|---|---|---|---|
| Wet pipe sprinkler | 26,643 | 15,559 | 87.0 | 84.0 | 13.0 | 3.1 | 96.5 | 89.2 |
| Dry pipe sprinkler | 3,002 | 1,572 | 79.1 | 75.9 | 20.9 | 3.2 | 96.0 | 80.9 |
| Other sprinkler (deluge, pre-action) | 599 | 325 | 72.0 | 56.6 | 28.0 | 15.4 | 78.6 | 62.6 |
| Dry chemical system | 1,317 | 767 | 59.8 | 44.7 | 40.2 | 15.1 | 74.7 | 49.9 |
| Carbon dioxide system | 415 | 355 | 93.5 | 87.3 | 6.5 | 6.2 | 93.4 | 88.6 |
| Foam system | 180 | 105 | 63.8 | 43.8 | 36.2 | 20.0 | 68.7 | 45.5 |
| Halogen-type system | 142 | 78 | 62.8 | 48.7 | 37.2 | 14.1 | 77.6 | 56.7 |
| Other special hazard system | 679 | 406 | 69.0 | 52.5 | 31.0 | 16.5 | 76.1 | 58.2 |
| Type undetermined | 3,431 | 779 | 40.6 | 37.1 | 59.4 | 3.5 | 91.5 | 40.4 |
| Type left blank | 17,414 | 1,286 | 68.5 | 65.2 | 31.5 | 3.3 | 95.2 | n/a |
Rates use fires large enough to activate. Special hazard rows (dry chemical, foam, halogen, CO2) cover non-water systems such as kitchen hood and equipment systems and are shown for context. 'Type left blank' rows are fires where the system type was not coded, which the coding guide allows when the fire was outside the system's designed range.
Source: [2][3][4][5][6][8] FEMA, U.S. Fire Administration, National Fire Data Center; FEMA, U.S. Fire Administration, National Fire Data Center; FEMA, U.S. Fire Administration, National Fire Data Center; FEMA, U.S. Fire Administration, National Fire Data Center; FEMA, U.S. Fire Administration, National Fire Data Center; U.S. Fire Administration
Fires large enough to activate, 2020 to 2024, percent
Source: FLS analysis of FEMA/USFA NFIRS Public Data Releases 2020 to 2024 (nonconfined building fires)
Special hazard systems (dry chemical, foam, halogen-type, carbon dioxide and other) had 1,711 large-enough fires between them. They operated and were effective in 55.5 percent and operated without effect in 13.9 percent, against 3.3 percent for sprinklers. The fire sprinkler inspection guide covers the water-based side, and systems served by a fire pump also depend on the checks described on the fire pump inspection page.
Why fire sprinklers fail: reasons ranked
Of 1,718 failed or ineffective sprinkler fires with a specific reason coded, 60.6 percent were fires outside the protected area. Setting those aside, conditions an inspection, testing and maintenance program is built to catch (shut-off systems, damaged parts, missed maintenance) account for 61.7 percent.
Sprinklers failed or were not effective in 3,016 fires large enough to activate them from 2020 to 2024. A specific reason was coded for 1,718; the rest were 'other', undetermined or blank (43.0 percent), a gap any reader of these figures should keep in mind.
| Reason (AES_FAIL) | Failed to operate | Operated, not effective | Total | Share of all (%) | Share of known reasons (%) | Share of known, excl. outside-area (%) | FLS classification |
|---|---|---|---|---|---|---|---|
| Fire not in area protected by the system | 882 | 159 | 1,041 | 34.5 | 60.6 | n/a | Coverage or design |
| Undetermined | 526 | 50 | 576 | 19.1 | n/a | n/a | Unknown |
| Reason left blank | 305 | 180 | 485 | 16.1 | n/a | n/a | Unknown |
| System shut off | 309 | 7 | 316 | 10.5 | 18.4 | 46.7 | ITM-addressable |
| Other reason | 212 | 25 | 237 | 7.9 | n/a | n/a | Unknown |
| Manual intervention defeated the system | 71 | 7 | 78 | 2.6 | 4.5 | 11.5 | Human action |
| Agent discharged but did not reach the fire | 2 | 70 | 72 | 2.4 | 4.2 | 10.6 | Possibly ITM (obstruction) |
| System components damaged | 58 | 9 | 67 | 2.2 | 3.9 | 9.9 | ITM-addressable |
| Not enough agent discharged | 12 | 45 | 57 | 1.9 | 3.3 | 8.4 | Possibly ITM (water supply) |
| Inappropriate system for the type of fire | 32 | 20 | 52 | 1.7 | 3.0 | 7.7 | Design or hazard change |
| Lack of maintenance (incl. corrosion, painted heads) | 29 | 6 | 35 | 1.2 | 2.0 | 5.2 | ITM-addressable |
Wet, dry and other sprinkler systems where AES_OPER was 2 (operated, not effective) or 4 (failed to operate). FLS classification: 'ITM-addressable' = conditions an inspection, testing and maintenance program is designed to find; it is our grouping, not a USFA category.
Source: [2][3][4][5][6][8][16] FEMA, U.S. Fire Administration, National Fire Data Center; FEMA, U.S. Fire Administration, National Fire Data Center; FEMA, U.S. Fire Administration, National Fire Data Center; FEMA, U.S. Fire Administration, National Fire Data Center; FEMA, U.S. Fire Administration, National Fire Data Center; U.S. Fire Administration; National Fire Protection Association (NFPA)
Share of 1,718 sprinkler fires with a specific reason coded, 2020 to 2024
Source: FLS analysis of FEMA/USFA NFIRS Public Data Releases 2020 to 2024 (nonconfined building fires)
Among failures to operate with a known reason other than coverage, the system had been shut off in 60.2 percent (513 known failures). Among sprinklers that operated without controlling the fire, the water did not reach the fire in 42.7 percent of known cases (164 fires). Manual intervention that defeated the system was 11.5 percent of known non-coverage reasons.
Building status matters. In buildings in normal use, sprinklers failed in 12.9 percent of large-enough fires. The rate was 30.7 percent in vacant and secured buildings, 61.3 percent in vacant and unsecured buildings, 33.5 percent under construction and 35.9 percent under major renovation.
Sprinkler performance by occupancy group
Apartments had the strongest record, with sprinklers operating effectively in 88.9 percent of large-enough fires; one- or two-family homes (75.1 percent), restaurants (71.7 percent) and schools (72.9 percent) were lowest among groups with 300 or more such fires.
Sprinklers were coded present in 12.6 percent of apartment building fires with known AES status, 49.7 percent of nursing home fires, 33.0 percent of manufacturing fires, 23.4 percent of warehouse fires and 0.4 percent of fires in one- or two-family homes.
| Occupancy group (PROP_USE) | Building fires | AES presence undetermined (%) | Sprinklered share, known status (%) | Sprinkler fires large enough to activate | Operated (%) | Operated and effective (%) | Failed to operate (%) | Operated and effective, excl. outside-area (%) | Failed, excl. outside-area (%) |
|---|---|---|---|---|---|---|---|---|---|
| One- or two-family home | 414,164 | 9.3 | 0.4 | 984 | 82.0 | 75.1 | 18.0 | 83.2 | 12.0 |
| Apartment or multifamily | 95,835 | 8.0 | 12.6 | 6,970 | 90.9 | 88.9 | 9.1 | 93.3 | 5.4 |
| Hotel or motel | 6,119 | 7.8 | 31.5 | 903 | 82.5 | 80.7 | 17.5 | 87.2 | 11.5 |
| Other residential (dorms, board and care, rooming) | 46,060 | 15.3 | 3.7 | 812 | 83.3 | 80.9 | 16.7 | 85.4 | 12.7 |
| Nursing home | 2,472 | 7.9 | 49.7 | 472 | 80.5 | 78.4 | 19.5 | 83.1 | 15.3 |
| Hospital, clinic, other health care (small base) | 2,440 | 11.5 | 30.5 | 268 | 80.2 | 77.2 | 19.8 | 81.2 | 15.7 |
| Office, bank, post office | 4,547 | 13.3 | 16.4 | 340 | 81.8 | 77.4 | 18.2 | 83.2 | 13.0 |
| Store or mercantile | 27,741 | 14.4 | 13.9 | 1,791 | 84.6 | 81.1 | 15.4 | 86.4 | 10.4 |
| Restaurant or bar | 11,426 | 14.6 | 17.0 | 988 | 79.6 | 71.7 | 20.4 | 81.4 | 11.8 |
| Other assembly | 8,378 | 14.3 | 13.2 | 493 | 78.5 | 76.7 | 21.5 | 82.2 | 16.3 |
| School or day care | 4,624 | 11.3 | 23.3 | 354 | 74.6 | 72.9 | 25.4 | 78.2 | 20.3 |
| Manufacturing or processing | 10,425 | 11.1 | 33.0 | 1,855 | 86.4 | 81.2 | 13.6 | 86.1 | 9.9 |
| Warehouse | 3,660 | 11.9 | 23.4 | 491 | 84.1 | 81.7 | 15.9 | 85.1 | 12.7 |
| Other storage (garages, sheds, self storage) (small base) | 57,818 | 5.6 | 0.6 | 212 | 85.8 | 83.0 | 14.2 | 86.3 | 10.8 |
| Industrial, utility, agriculture (small base) | 5,332 | 10.5 | 7.7 | 226 | 87.2 | 80.1 | 12.8 | 84.6 | 9.3 |
| Jail, prison, police station (small base) | 691 | 14.9 | 32.1 | 72 | 77.8 | 72.2 | 22.2 | 80.0 | 15.4 |
| Other, none or undetermined (small base) | 28,415 | 16.0 | 1.6 | 225 | 79.6 | 74.2 | 20.4 | 75.9 | 19.5 |
Occupancy from PROP_USE. Groups with fewer than 300 large-enough sprinkler fires are flagged as small bases. Sprinklered share uses fires with known AES status as the denominator.
Source: [2][3][4][5][6] FEMA, U.S. Fire Administration, National Fire Data Center; FEMA, U.S. Fire Administration, National Fire Data Center; FEMA, U.S. Fire Administration, National Fire Data Center; FEMA, U.S. Fire Administration, National Fire Data Center; FEMA, U.S. Fire Administration, National Fire Data Center
Occupancy groups with 300 or more large-enough sprinkler fires, 2020 to 2024, percent, as coded
Source: FLS analysis of FEMA/USFA NFIRS Public Data Releases 2020 to 2024 (nonconfined building fires)
Nursing homes had the highest sprinklered share of any group, yet sprinklers failed to operate in 19.5 percent of their 472 large-enough fires as coded (15.3 percent outside-area excluded). Inspection findings for those facilities are in our nursing home fire safety deficiencies report. Restaurants show the largest share of fires where sprinklers operated without effect (7.9 percent), a pattern NFIRS does not explain.
Hotels (80.7 percent), warehouses (81.7 percent), manufacturing (81.2 percent) and offices (77.4 percent) sit between those ends. Which buildings must have sprinklers at all depends on the code your state adopted; the requirement finder and the high-rise sprinkler retrofit laws report cover that side.
How many sprinkler heads opened
One head opened in 75.3 percent of operated sprinkler fires with a valid count, and five or fewer in 96.5 percent. Effectiveness drops as more heads open.
The NFIRS field for heads operating had a valid count (1 to 250) for 15,010 operated sprinkler fires. The median was 1 head when the system was effective and 2 when it was not; the 90th percentile was 3 heads vs 9.
| Sprinkler heads operating (NO_SPR_OP) | Wet pipe | Dry pipe | Other sprinkler | All sprinkler fires | Share of fires with a valid count (%) | Effective in this group (%) |
|---|---|---|---|---|---|---|
| 1 head | 10,382 | 816 | 111 | 11,309 | 75.3 | 97.6 |
| 2 heads | 1,798 | 202 | 38 | 2,038 | 13.6 | 94.5 |
| 3 to 5 heads | 941 | 141 | 51 | 1,133 | 7.5 | 91.1 |
| 6 to 10 heads | 252 | 43 | 25 | 320 | 2.1 | 82.8 |
| 11 or more heads | 161 | 41 | 8 | 210 | 1.4 | 80.5 |
| Valid counts, total | 13,534 | 1,243 | 233 | 15,010 | 100.0 | 96.2 |
Fires where sprinklers operated (AES_OPER 1 or 2). 8 operated fires with a blank, zero or over-250 head count are excluded.
Source: [2][3][4][5][6] FEMA, U.S. Fire Administration, National Fire Data Center; FEMA, U.S. Fire Administration, National Fire Data Center; FEMA, U.S. Fire Administration, National Fire Data Center; FEMA, U.S. Fire Administration, National Fire Data Center; FEMA, U.S. Fire Administration, National Fire Data Center
Share of 15,010 operated sprinkler fires with a valid head count, 2020 to 2024
Source: FLS analysis of FEMA/USFA NFIRS Public Data Releases 2020 to 2024 (nonconfined building fires)
When one head opened, the system was effective in 97.6 percent of fires; when 11 or more opened, in 80.5 percent. One head opened in 76.7 percent of wet pipe fires and 65.6 percent of dry pipe fires. The coding guide notes that the head count reflects how fast the fire grew and is not itself a measure of effectiveness.
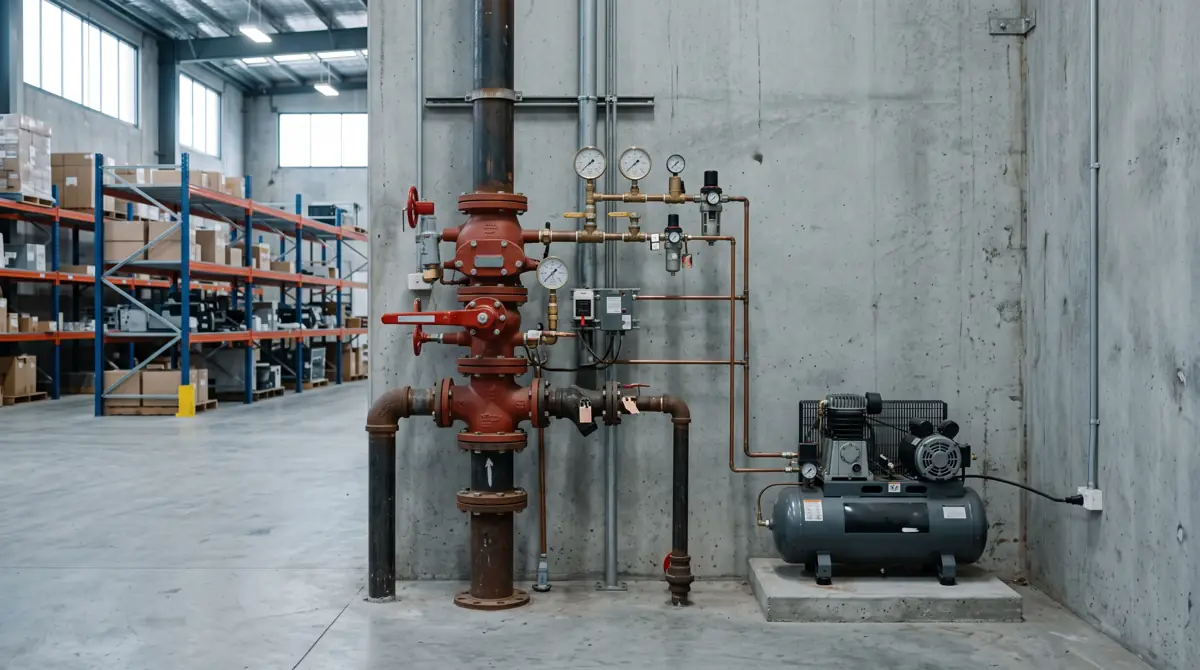
Deaths, injuries and dollar loss with and without sprinklers
Building fires with sprinklers present had 2.41 civilian deaths per 1,000 fires, against 10.84 where no AES was present, 77.8 percent lower. This is an association inside NFIRS, not proof that sprinklers caused the whole difference.
In residential buildings the death rate was 3.46 per 1,000 fires with sprinklers present and 12.94 with none (73.3 percent lower). In nonresidential buildings it was 1.25 vs 2.43 (48.6 percent lower). Fire spread stayed within the object or room of origin in 84.7 percent of sprinklered fires and 46.2 percent of fires with no AES.
| Property group | Protection | Fires | Civilian deaths | Deaths per 1,000 fires | Civilian injuries per 1,000 fires | Mean loss per fire ($) | Loss per 1,000 fires ($ millions) | Median loss per fire ($) | Spread confined to object or room (%) |
|---|---|---|---|---|---|---|---|---|---|
| All | Sprinklers present | 30,244 | 73 | 2.41 | 42.1 | 112,743 | 112.7 | 3,500 | 84.7 |
| All | No AES present | 601,972 | 6,527 | 10.84 | 33.4 | 59,699 | 59.7 | 5,000 | 46.2 |
| Residential | Sprinklers present | 15,878 | 55 | 3.46 | 53.9 | 58,060 | 58.1 | 4,000 | 87.8 |
| Residential | No AES present | 481,802 | 6,235 | 12.94 | 38.8 | 53,869 | 53.9 | 5,000 | 49.5 |
| Nonresidential | Sprinklers present | 14,366 | 18 | 1.25 | 29.0 | 172,521 | 172.5 | 3,000 | 81.2 |
| Nonresidential | No AES present | 120,170 | 292 | 2.43 | 11.8 | 83,093 | 83.1 | 2,500 | 32.8 |
Association within NFIRS, not causation: sprinklered buildings differ in size, construction, occupancy and value. Loss is PROP_LOSS + CONT_LOSS in nominal dollars, fires with loss reported, errata-flagged values removed.
Source: [2][3][4][5][6] FEMA, U.S. Fire Administration, National Fire Data Center; FEMA, U.S. Fire Administration, National Fire Data Center; FEMA, U.S. Fire Administration, National Fire Data Center; FEMA, U.S. Fire Administration, National Fire Data Center; FEMA, U.S. Fire Administration, National Fire Data Center
Sprinklers present vs no AES, 2020 to 2024 (association, not causation)
Source: FLS analysis of FEMA/USFA NFIRS Public Data Releases 2020 to 2024 (nonconfined building fires)
Two results run against the usual message and are reported as found. Civilian injuries per 1,000 fires were higher with sprinklers present (42.1 vs 33.4); 355 of the 1,272 injuries in sprinkler fires (27.9 percent) came from fires too small to activate the system. Mean dollar loss was also higher: $112,743 per sprinklered fire (112.7 million dollars per 1,000 fires) against $59,699 (59.7 million). The median loss points the other way, $3,500 vs $5,000, which suggests a few very large losses in big sprinklered industrial and storage buildings drive the mean. NFIRS dollar figures are fire officer estimates in nominal dollars.
How these counts compare with NFPA's national estimates
NFPA's U.S. Experience with Sprinklers (published 2026-10-01) covers the same 2020 to 2024 period with national estimates. Our raw counts land close to NFPA once fires outside the protected area are removed, and add the yearly series, the unknown shares, counted failure reasons and finer occupancy groups.
NFPA reports that sprinklers operated in 90 percent of fires large enough to activate them, were effective in 97 percent of those, and operated effectively in 87 percent, and that the death rate per fire was 90 percent lower with sprinklers than with no AES. NFPA estimates an annual average of 935 fires where the sprinkler system failed to operate and names a shut-off system as the most common reason.
| Measure, 2020-2024 | NFPA national estimate | FLS raw NFIRS count, as coded | FLS, excluding fires outside the protected area |
|---|---|---|---|
| Operated, fires large enough to activate (%) | 90 | 86.0 | 90.5 |
| Effective when operated (%) | 97 | 96.2 | 97.2 |
| Operated and effective (%) | 87 | 82.7 | 88.0 |
| Only one head operated (%) | 76 | 75.3 | same |
| Five or fewer heads operated (%) | 97 | 96.5 | same |
| Civilian death rate, sprinklers vs no AES (% lower) | 90 | 77.8 | same |
| Spread confined to object or room, sprinklers present (%) | 93 | 84.7 | same |
| Spread confined to object or room, no AES (%) | 68 | 46.2 | same |
| Fires with a sprinkler system present (%) | 11 | 4.6 | same |
NFPA figures are national estimates published 2026-10-01 and combine NFIRS with NFPA's fire experience survey. FLS figures are raw counts of nonconfined building fires reported to NFIRS.
Source: [2][3][4][5][6][15] FEMA, U.S. Fire Administration, National Fire Data Center; FEMA, U.S. Fire Administration, National Fire Data Center; FEMA, U.S. Fire Administration, National Fire Data Center; FEMA, U.S. Fire Administration, National Fire Data Center; FEMA, U.S. Fire Administration, National Fire Data Center; National Fire Protection Association (NFPA)
The gaps have known sources. NFPA scales NFIRS to national totals with its own survey and excludes properties under construction; we report counts as filed, keep undetermined values visible and exclude only what USFA's errata require. Our sprinkler presence share (4.6 percent) is lower than NFPA's 11 percent partly because 17,414 present-AES fires with a blank type are not counted as sprinkler fires. Our death-rate gap (77.8 percent) is a raw ratio without NFPA's allocation of unknowns.
2025: the last NFIRS year is incomplete
USFA lists January 31, 2026 as the final date for NFIRS, which NERIS replaced. Building fires in the 2025 file fall to 52.7 percent of the 2024 level by December, so 2025 is shown as a partial check, not part of the trend.
The 2025 release notes report 21,366 departments and nearly 1,076,400 fire runs, against 22,582 departments and nearly 1,224,400 fire runs in 2024, a 12.1 percent drop in fire runs. In our universe, January 2025 building fires were 95.0 percent of January 2024; December 2025 was 52.7 percent of December 2024 (USFA on NERIS).
Rates from the partial year match the earlier years: sprinklers operated and were effective in 83.3 percent of large-enough 2025 fires and failed in 13.6 percent. Because 2025 is the last NFIRS release, future editions of this report will need NERIS data, which uses a different schema.
The numbers in one list
- From 2020 to 2024, sprinklers failed to operate in 14.0 percent of 17,456 NFIRS building fires large enough to activate them (U.S., raw counts).[2][3][4][5][6]
- Sprinklers operated and were effective in 82.7 percent of those fires and operated in 86.0 percent (2020 to 2024, NFIRS).[2][3][4][5][6]
- When sprinklers operated, they controlled the fire 96.2 percent of the time (2020 to 2024, NFIRS).[2][3][4][5][6]
- Excluding fires coded as outside the protected area, the operated-and-effective rate was 88.0 percent and the failure rate 9.5 percent (2020 to 2024, NFIRS).[2][3][4][5][6]
- Sprinklers were coded present in 4.6 percent of NFIRS building fires with known AES status, 2020 to 2024; presence was undetermined in 9.9 percent.[2][3][4][5][6]
- Dry pipe systems failed in 20.9 percent of large-enough fires vs 13.0 percent for wet pipe systems (2020 to 2024, NFIRS).[2][3][4][5][6]
- A system shut off before the fire accounted for 60.2 percent of known failures to operate, outside-area fires excluded (2020 to 2024, NFIRS).[2][3][4][5][6]
- Fire not in the area protected was the most common coded reason, 60.6 percent of known reasons for failure or ineffectiveness (2020 to 2024, NFIRS).[2][3][4][5][6]
- Shut-off systems, damaged parts and lack of maintenance made up 61.7 percent of known non-coverage failure reasons (2020 to 2024, NFIRS; FLS grouping).[2][3][4][5][6]
- In vacant and unsecured buildings sprinklers failed in 61.3 percent of large-enough fires vs 12.9 percent in buildings in normal use (2020 to 2024, NFIRS).[2][3][4][5][6]
- In apartment building fires, sprinklers operated and were effective in 88.9 percent of large-enough fires; in nursing homes, 78.4 percent (2020 to 2024, NFIRS).[2][3][4][5][6]
- One sprinkler head opened in 75.3 percent of operated sprinkler fires with a valid count (2020 to 2024, NFIRS).[2][3][4][5][6]
- Civilian deaths were 2.41 per 1,000 building fires with sprinklers present vs 10.84 with no AES, 77.8 percent lower (2020 to 2024, NFIRS; association).[2][3][4][5][6]
- In the 2025 NFIRS file, December building fires were 52.7 percent of December 2024 as departments moved to NERIS.[7][13]
Calculations
Operated-and-effective rate among fires large enough to activate
FormulaAES_OPER 1 / (AES_OPER 1 + 2 + 4)
Inputs: derived_metrics d9 to d14 (fact sheet rows)
Result: 82.7 percent as coded; 88.0 percent excluding outside-area fires
Most of the gap to NFPA's estimate closes when fires outside the protected area are removed.
Limitations: Raw counts, not national estimates; reporting officer judgment on effectiveness.
Failure and ineffectiveness by system type
FormulaAES_OPER 4 (or 2) / large-enough, by AES_TYPE
Inputs: table t2 (fact sheet rows)
Result: Failed: wet 13.0, dry 20.9, other sprinkler 28.0 percent
Dry and specialty sprinkler systems fail more often than wet pipe systems.
Limitations: System type correlates with building use and climate.
ITM-addressable share of known failure reasons
Formula(codes 1 + 6 + 7) / known reasons, with and without code 5
Inputs: table t3 (fact sheet rows)
Result: 24.3 percent of all known; 61.7 percent excluding outside-area; 80.8 percent adding codes 2 and 3
Most failures inside the protected area involve conditions inspections look for.
Limitations: Our grouping; 43.0 percent of failures have no specific reason.
Deaths per 1,000 fires, sprinklers present vs no AES
Formulasum OTH_DEATH / fires x 1,000; percent difference
Inputs: table t6 (fact sheet rows)
Result: 2.41 vs 10.84 (77.8 percent lower); residential 73.3; nonresidential 48.6
Large association, strongest in residential buildings.
Limitations: Not causal; occupancy mix and building features differ.
Dollar loss per 1,000 fires
Formulamean (PROP_LOSS + CONT_LOSS) x 1,000
Inputs: table t6 (fact sheet rows)
Result: 112.7 vs 59.7 million dollars (sprinklers vs no AES); medians $3,500 vs $5,000
Mean loss is higher with sprinklers because of a few very large losses; the median is lower.
Limitations: Nominal dollars; officer estimates; skewed distribution.
Failure rate by building status
FormulaAES_OPER 4 / large-enough, by STRUC_STAT
Inputs: tables/q_status_failed.csv (fact sheet rows)
Result: normal use 12.9; vacant unsecured 61.3; renovation 35.9 percent
Impairments during vacancy and renovation stand out.
Limitations: Small bases outside normal use.
Questions people ask
How often do fire sprinklers fail?
In 2,438 of 17,456 large-enough NFIRS building fires from 2020 to 2024 (14.0 percent), sprinklers did not operate. In another 578 (3.3 percent) they operated but did not control the fire.
Why do fire sprinklers fail?
Of known reasons, 60.6 percent were fires outside the protected area. Inside the protected area, shut-off systems led, followed by manual intervention, water not reaching the fire, damaged components, too little water, the wrong system type and lack of maintenance (NFIRS, 2020 to 2024).
How effective are fire sprinklers?
When they operated, sprinklers controlled the fire in 96.2 percent of NFIRS building fires from 2020 to 2024; NFPA's national estimate is 97 percent.
Summary
- Sprinklers failed to operate in 14.0 percent of 17,456 NFIRS building fires large enough to activate them, 2020 to 2024, and operated without effect in 3.3 percent.
- They operated and were effective in 82.7 percent as coded, or 88.0 percent when fires outside the protected area are excluded, close to NFPA's 87 percent national estimate.
- Wet pipe systems failed in 13.0 percent of large-enough fires, dry pipe systems in 20.9 percent.
- Inside the protected area, a shut-off system was the leading known cause of failure to operate (60.2 percent); shut-off, damaged and unmaintained systems together were 61.7 percent of known non-coverage reasons.
- Failure rates were far higher in vacant, unsecured buildings (61.3 percent) and buildings under renovation (35.9 percent) than in buildings in normal use (12.9 percent).
- Apartments showed the best record (88.9 percent operated and effective); one- or two-family homes, restaurants and schools the weakest among larger groups.
- Civilian deaths were 2.41 per 1,000 fires with sprinklers present vs 10.84 with no AES; injuries and mean dollar loss were higher, which we report as found.
Frequently asked questions
What is the fire sprinkler failure rate?
In NFIRS building fires from 2020 to 2024, sprinklers failed to operate in 14.0 percent of fires large enough to activate them and operated without effect in 3.3 percent. Leaving out fires outside the protected area, the failure rate was 9.5 percent.
How often do fire sprinklers work?
Sprinklers operated and were effective in 82.7 percent of large-enough NFIRS building fires from 2020 to 2024, or 88.0 percent excluding fires outside the protected area. NFPA's national estimate for the same years is 87 percent.
What is the most common reason sprinklers fail?
The most common coded reason was a fire outside the area the system protects (60.6 percent of known reasons, 2020 to 2024). Among failures to operate inside the protected area, a shut-off system led at 60.2 percent.
Do dry pipe sprinklers fail more often than wet pipe sprinklers?
Yes, in NFIRS 2020 to 2024: dry pipe systems failed in 20.9 percent of large-enough fires and wet pipe systems in 13.0 percent. The two system types are installed in different kinds of spaces, so the buildings differ too.
How many sprinkler heads usually open in a fire?
One head opened in 75.3 percent of operated sprinkler fires with a valid count, and five or fewer in 96.5 percent (NFIRS, 2020 to 2024).
Are deaths lower in buildings with sprinklers?
Yes, within NFIRS: 2.41 civilian deaths per 1,000 building fires with sprinklers present vs 10.84 with no AES from 2020 to 2024. This is an association; sprinklered buildings differ in other ways.
What share of building fires had sprinklers?
A sprinkler system was coded present in 4.6 percent of NFIRS building fires with known AES status from 2020 to 2024; any automatic extinguishing system, including kitchen hood systems, in 8.2 percent.
Why are confined fires left out?
Confined fires (cooking, chimney, trash fires) need no Fire Module in NFIRS. Only 29.3 percent had one from 2020 to 2024, so AES fields are mostly blank and USFA guidance removes them from AES analysis.
Is 2025 data included?
Only as a partial check. USFA lists January 31, 2026 as NFIRS's final date; December 2025 building fires in the file were 52.7 percent of December 2024. Rates for 2025 (83.3 percent operated and effective) match earlier years.
How could building owners reduce sprinkler failures?
The data point to shut-off valves, damaged parts and missed maintenance as 61.7 percent of known non-coverage failure reasons from 2020 to 2024. Those are the conditions an NFPA 25 inspection, testing and maintenance program is designed to find; this is a data observation, not engineering advice.
Download the data
Every table in this report is available as a CSV under CC BY 4.0. The fact sheet lists each value with its source URL and access date.
- derived_metrics.csv (CSV)
- fact_sheet.csv (CSV)
- Fire sprinkler failure rate by year, NFIRS building fires, 2020 to 2025 (CSV)
- Operation and effectiveness by system type, 2020 to 2024 (CSV)
- Why sprinklers failed or were not effective, ranked, 2020 to 2024 (CSV)
- Sprinkler presence and performance by occupancy group, 2020 to 2024 (CSV)
- Number of sprinkler heads that operated, 2020 to 2024 (CSV)
- Civilian deaths, injuries and dollar loss with sprinklers present vs no AES, 2020 to 2024 (CSV)
- How confined fires and non-building structures were handled, by year (CSV)
- FLS raw NFIRS counts compared with NFPA's national estimates, 2020 to 2024 (CSV)
For journalists and researchers
If you cite only a few, cite these
- Sprinklers failed to operate in 14.0 percent of U.S. building fires large enough to activate them, in fires reported to NFIRS from 2020 to 2024.[2][3][4][5][6]
- A shut-off system explained 60.2 percent of known sprinkler failures to operate inside the protected area (NFIRS, 2020 to 2024).[2][3][4][5][6]
- Civilian deaths were 2.41 per 1,000 building fires with sprinklers present vs 10.84 with none (NFIRS, 2020 to 2024).[2][3][4][5][6]
Most quotable statistics
- Sprinklers failed to operate in 14.0 percent of U.S. building fires large enough to activate them, in fires reported to NFIRS from 2020 to 2024.[2][3][4][5][6]
- When sprinklers operated, they controlled the fire 96.2 percent of the time (NFIRS, 2020 to 2024).[2][3][4][5][6]
- Dry pipe sprinklers failed in 20.9 percent of large-enough fires, wet pipe in 13.0 percent (NFIRS, 2020 to 2024).[2][3][4][5][6]
- A shut-off system explained 60.2 percent of known sprinkler failures to operate inside the protected area (NFIRS, 2020 to 2024).[2][3][4][5][6]
- In vacant, unsecured buildings, sprinklers failed in 61.3 percent of large-enough fires (NFIRS, 2020 to 2024).[2][3][4][5][6]
- Civilian deaths were 2.41 per 1,000 building fires with sprinklers present vs 10.84 with none (NFIRS, 2020 to 2024).[2][3][4][5][6]
Press summary
A new Fire Life and Safety analysis of FEMA's National Fire Incident Reporting System counts 17,456 U.S. building fires from 2020 to 2024 where sprinklers were present and the fire was large enough to set them off. Sprinklers failed to operate in 14.0 percent of those fires and operated without controlling the fire in 3.3 percent. When they operated, they worked 96.2 percent of the time. The most common coded reason for failure was a fire outside the area the system covers. Inside the protected area, a system shut off before the fire led, at 60.2 percent of known failures to operate. Dry pipe systems failed more often than wet pipe systems, 20.9 percent vs 13.0 percent, and failure rates were markedly higher in vacant buildings and buildings under renovation. Civilian deaths were 2.41 per 1,000 fires with sprinklers vs 10.84 without. All counts and code are published as open CSV files.
Suggested headlines
- Sprinklers failed in 14.0% of U.S. building fires big enough to trigger them, NFIRS data show
- Shut-off valves behind 60.2% of known sprinkler failures inside protected areas
- Dry pipe sprinklers fail more often than wet pipe: 20.9% vs 13.0%
- Vacant buildings see sprinkler failures in 61.3% of large fires
- One sprinkler head was enough in 75.3% of fires where sprinklers opened
How to cite this report
Fire Life and Safety. (2026). Fire Sprinkler Failure Rate in U.S. Building Fires, 2020 to 2025. Retrieved from https://firelifeandsafety.com/reports/fire-sprinkler-failure-rate/
Reuse license
Data and tables are licensed CC BY 4.0. Attribution: “Source: Fire Life and Safety, Fire Sprinkler Failure Rate in U.S. Building Fires, 2020 to 2025” with a link to this page.
Methodology
Data: the FEMA/USFA NFIRS Fire and Hazardous Materials Public Data Releases for 2020 to 2025 (NFIRS Public Data Release), loaded unchanged into a read-only database. fireincident was joined to basicincident on INCIDENT_KEY and data year. Every code value used (AES_PRES, AES_TYPE, AES_OPER, AES_FAIL, PROP_USE, INC_TYPE, STRUC_TYPE, STRUC_STAT, FIRE_SPRD, AID) was checked against the codelookup table and the NFIRS 5.0 Complete Reference Guide, Chapter 5, Section M.
Universe: nonconfined building fires per the USFA analysis guidelines (INC_TYPE 111 and 120 to 123; STRUC_TYPE 1 or 2), aid given (AID 3 or 4) removed, and every incident each year's Data Quality Errata Addendum says to exclude from all analyses removed. Incidents the errata flag for dollar loss only were dropped from loss figures. Exposure fires were kept, as separate fires. Confined fires (113 to 118) were counted separately and excluded from all AES rates because their Fire Module is optional.
Sprinkler fires: AES_PRES 1 (present) and AES_TYPE 1, 2 or 3. Partial systems (AES_PRES 2) and present systems with a blank type were not counted as sprinkler fires; both counts are shown. 'Large enough to activate' means AES_OPER 1, 2 or 4. Rates exclude AES_OPER 3 (too small), 0 (other), U and blank from the denominator, and each excluded count is published. A second set of rates also removes fires with AES_FAIL 5 (fire not in area protected).
Failure reasons are AES_FAIL for sprinkler fires with AES_OPER 2 or 4. The ITM-addressable grouping (codes 1, 6, 7; possibly 2 and 3) is an FLS classification, not a USFA category. Occupancy groups come from PROP_USE codes (for example 419 one- or two-family, 429 multifamily, 311 nursing home, 891 warehouse, 700 series manufacturing). Head counts outside 1 to 250 were treated as invalid, following data quality notes that flag extreme values.
Outcomes: civilian deaths and injuries (OTH_DEATH, OTH_INJ, blank as zero) and dollar loss (PROP_LOSS + CONT_LOSS, nominal, fires with loss reported). Comparisons of sprinklers present vs no AES are associations inside NFIRS: sprinklered buildings differ in size, use, construction and occupants, and no adjustment was made for those differences.
Limits: NFIRS is voluntary and is not a census, so counts are 'fires reported to NFIRS', not national totals, and no state ranking is made. Effectiveness and failure reasons are the reporting officer's judgment. 2025 is incomplete because departments moved to NERIS during the year, so the trend stops at 2024 and 2025 is shown as a partial check. Conflicts with NFPA's published figures are shown side by side in table t8 rather than resolved; NFPA's figures are national estimates built with a different method.
Derived metrics are listed with formulas and input rows in derived_metrics.csv; all SQL is in the scripts folder and reruns against the public files. This report is a data summary and not engineering, legal or insurance advice; sprinkler requirements depend on the code edition adopted by your state and local jurisdiction. Last updated 2026-11-01.
This report presents published data with its limitations. It is not legal, engineering, financial or investment advice. Requirements depend on the code edition your state and local fire marshal have adopted; confirm with your authority having jurisdiction.
Sources, ranked by quality
Tier 1: primary and official sources (17)
- [1] FEMA, U.S. Fire Administration. FEMA/USFA NFIRS Annual Data (OpenFEMA data set page). Public Data Releases 1980 to 2025. Accessed 2026-11-01.
- [2] FEMA, U.S. Fire Administration, National Fire Data Center. NFIRS Fire and Hazardous Materials Public Data Release 2020 (fireincident, basicincident, codelookup, release notes, errata addendum). Incidents dated 2020. Accessed 2026-11-01.
- [3] FEMA, U.S. Fire Administration, National Fire Data Center. NFIRS Fire and Hazardous Materials Public Data Release 2021 (fireincident, basicincident, codelookup, release notes, errata addendum). Incidents dated 2021. Accessed 2026-11-01.
- [4] FEMA, U.S. Fire Administration, National Fire Data Center. NFIRS Fire and Hazardous Materials Public Data Release 2022 (fireincident, basicincident, codelookup, release notes, errata addendum). Incidents dated 2022. Accessed 2026-11-01.
- [5] FEMA, U.S. Fire Administration, National Fire Data Center. NFIRS Fire and Hazardous Materials Public Data Release 2023 (fireincident, basicincident, codelookup, release notes, errata addendum). Incidents dated 2023. Accessed 2026-11-01.
- [6] FEMA, U.S. Fire Administration, National Fire Data Center. NFIRS Fire and Hazardous Materials Public Data Release 2024 (fireincident, basicincident, codelookup, release notes, errata addendum). Incidents dated 2024. Accessed 2026-11-01.
- [7] FEMA, U.S. Fire Administration, National Fire Data Center. NFIRS Fire and Hazardous Materials Public Data Release 2025 (fireincident, basicincident, codelookup, release notes, errata addendum). Incidents dated 2025 (released 2026-05-01; incomplete, NERIS transition). Accessed 2026-11-01.
- [8] U.S. Fire Administration. NFIRS 5.0 Complete Reference Guide (2015), Chapter 5 Section M, Automatic Extinguishing System. Coding rules in force 2015 to 2025. Accessed 2026-11-01.
- [9] U.S. Fire Administration. NFIRS 5.0 Fire Data Analysis Guidelines and Issues. Analysis rules (building fires, confined fires, AES). Accessed 2026-11-01.
- [10] U.S. Fire Administration. National Fire Incident Reporting System (NFIRS) home page. Program status 2026. Accessed 2026-11-01.
- [11] U.S. Fire Administration. NFIRS Documentation (final date for NFIRS: Jan. 31, 2026). 2026. Accessed 2026-11-01.
- [12] U.S. Fire Administration. NFIRS Reporting Guidelines (2025 data deadline Jan. 31, 2026). 2024 and 2025 reporting years. Accessed 2026-11-01.
- [13] U.S. Fire Administration. National Emergency Response Information System (NERIS). 2026. Accessed 2026-11-01.
- [15] National Fire Protection Association (NFPA). U.S. Experience with Sprinklers (Tucker McGree, published 2026-10-01). 2020-2024 national estimates. Accessed 2026-11-01.
- [16] National Fire Protection Association (NFPA). NFPA 25, Standard for the Inspection, Testing, and Maintenance of Water-Based Fire Protection Systems (2026 edition). 2026 edition. Accessed 2026-11-01.
- [17] National Fire Protection Association (NFPA). NFPA 13, Standard for the Installation of Sprinkler Systems (2025 edition). 2025 edition. Accessed 2026-11-01.
- [18] National Fire Protection Association (NFPA). NFPA 13R, Standard for the Installation of Sprinkler Systems in Low-Rise Residential Occupancies. Current edition. Accessed 2026-11-01.
Tier 2: trade bodies, market research, company data (1)
- [14] Fire Safety Research Institute (UL Research Institutes). NERIS: The National Emergency Response Information System. Sole national system since January 2026. Accessed 2026-11-01.